 3
3peptides
spectra
0.000 | 0.090
0.000 | 0.000
0.000 | 0.023
0.000 | 0.375
0.000 | 0.447
0.000 | 0.234
0.000 | 0.135
0.413 | 0.588
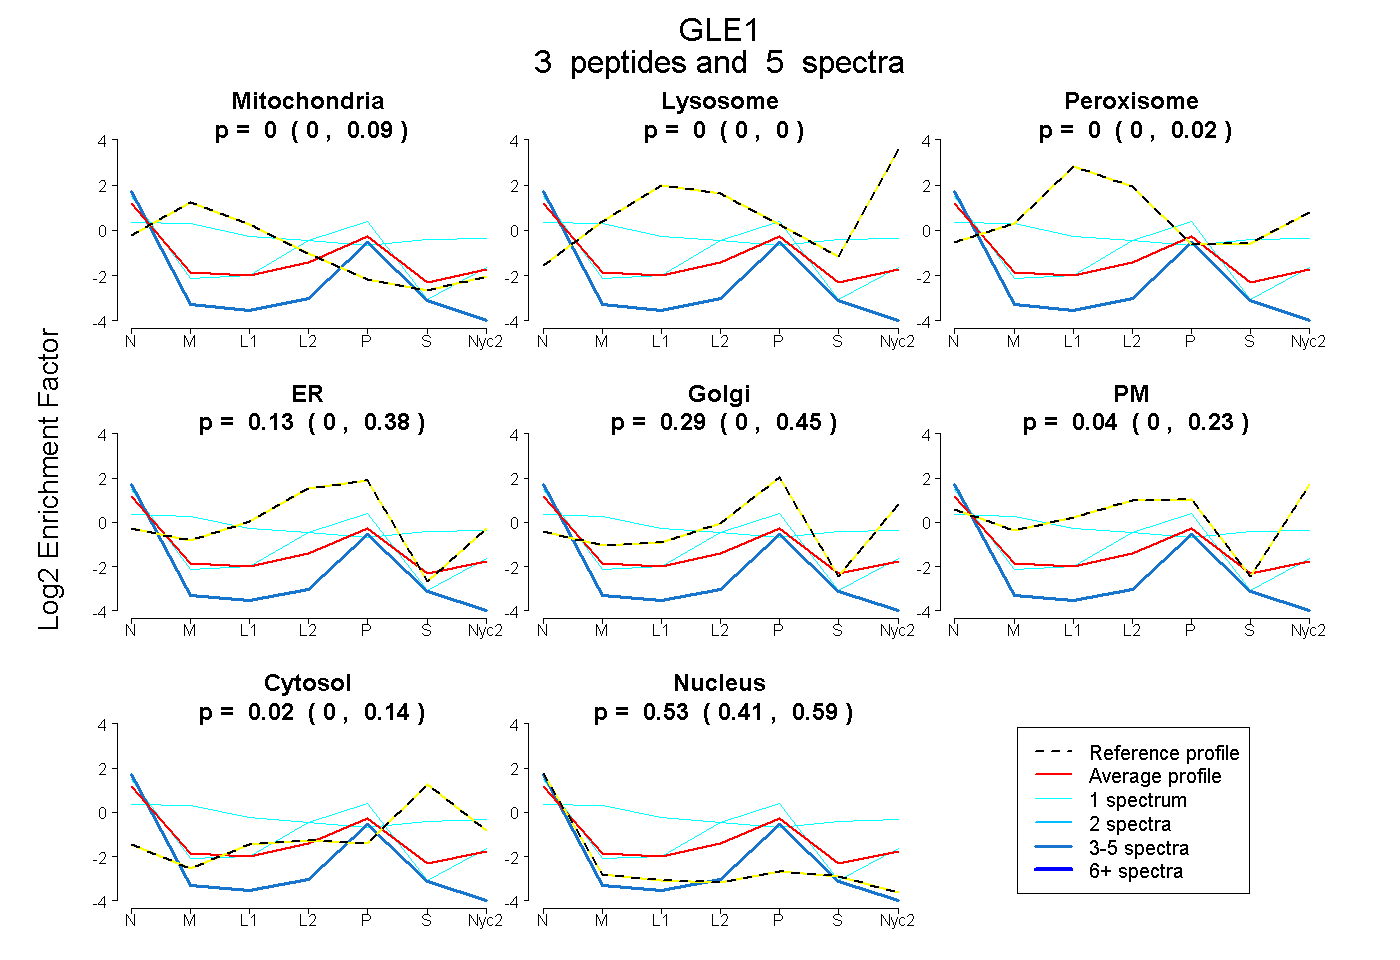
| Plot | Mito | Lyso | Perox | ER | Golgi | PM | Cytosol | Nucleus | |||||
| Expt A |
3 peptides |
5 spectra |
|
0.000 0.000 | 0.090 |
0.000 0.000 | 0.000 |
0.000 0.000 | 0.023 |
0.125 0.000 | 0.375 |
0.289 0.000 | 0.447 |
0.044 0.000 | 0.234 |
0.017 0.000 | 0.135 |
0.525 0.413 | 0.588 |
| 1 spectrum, QYQVQFWK | 0.323 | 0.000 | 0.093 | 0.000 | 0.000 | 0.278 | 0.307 | 0.000 | ||
| 1 spectrum, GFLTPSFWR | 0.000 | 0.000 | 0.000 | 0.431 | 0.114 | 0.000 | 0.000 | 0.455 | ||
| 3 spectra, VGDLILAHLHK | 0.000 | 0.000 | 0.000 | 0.000 | 0.106 | 0.000 | 0.000 | 0.894 |