 11
11peptides
spectra
0.728 | 0.786
0.000 | 0.000
0.075 | 0.110
0.000 | 0.000
0.000 | 0.030
0.000 | 0.000
0.112 | 0.158
0.000 | 0.000
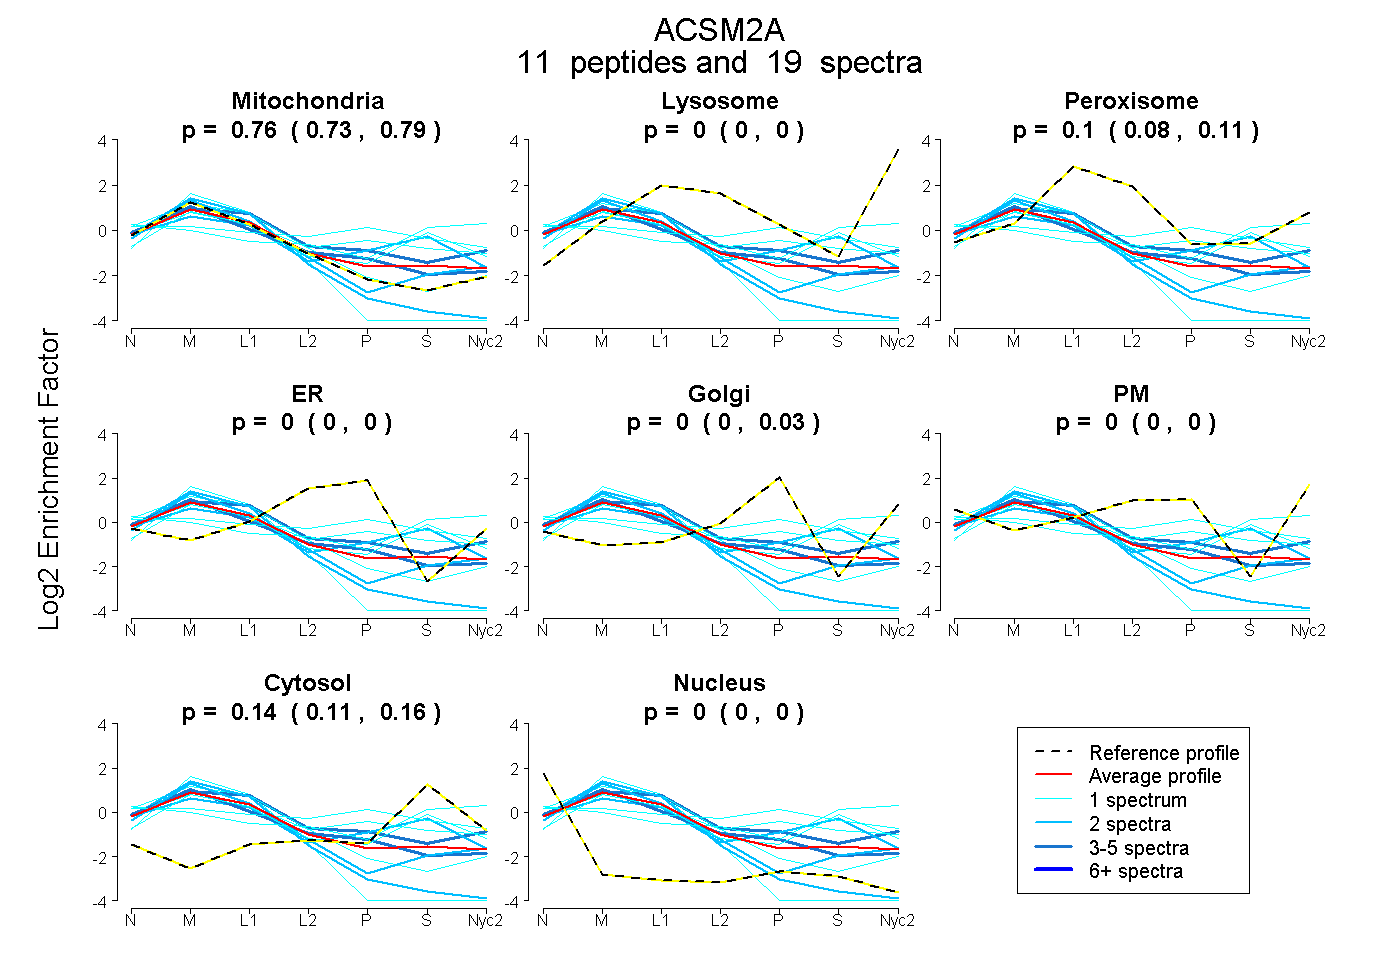
| Plot | Mito | Lyso | Perox | ER | Golgi | PM | Cytosol | Nucleus | |||||
| Expt A |
11 peptides |
19 spectra |
|
0.761 0.728 | 0.786 |
0.000 0.000 | 0.000 |
0.098 0.075 | 0.110 |
0.000 0.000 | 0.000 |
0.001 0.000 | 0.030 |
0.000 0.000 | 0.000 |
0.140 0.112 | 0.158 |
0.000 0.000 | 0.000 |
| 3 spectra, SVTAPYK | 0.798 | 0.000 | 0.002 | 0.043 | 0.083 | 0.000 | 0.074 | 0.000 | ||
| 1 spectrum, VPEWWLVTLGCMR | 0.248 | 0.103 | 0.046 | 0.000 | 0.000 | 0.177 | 0.427 | 0.000 | ||
| 1 spectrum, VAVVLPR | 0.506 | 0.000 | 0.167 | 0.000 | 0.000 | 0.000 | 0.328 | 0.000 | ||
| 1 spectrum, AFVVLAPEFLSHDQDQLTK | 0.983 | 0.000 | 0.000 | 0.000 | 0.000 | 0.000 | 0.000 | 0.017 | ||
| 1 spectrum, EGDMALR | 0.475 | 0.000 | 0.185 | 0.000 | 0.171 | 0.000 | 0.169 | 0.000 | ||
| 4 spectra, DTEGYFHFMGR | 0.575 | 0.000 | 0.242 | 0.000 | 0.123 | 0.000 | 0.061 | 0.000 | ||
| 2 spectra, EGWLNFK | 0.553 | 0.000 | 0.113 | 0.000 | 0.008 | 0.000 | 0.326 | 0.000 | ||
| 2 spectra, GDFWLLGDR | 0.934 | 0.000 | 0.000 | 0.000 | 0.000 | 0.000 | 0.000 | 0.066 | ||
| 1 spectrum, TQANIR | 0.260 | 0.000 | 0.185 | 0.051 | 0.214 | 0.030 | 0.261 | 0.000 | ||
| 2 spectra, TDDIINSSGYR | 0.911 | 0.000 | 0.027 | 0.000 | 0.000 | 0.000 | 0.062 | 0.000 | ||
| 1 spectrum, EIYGQTETGITCR | 0.926 | 0.000 | 0.071 | 0.000 | 0.000 | 0.000 | 0.000 | 0.003 |
| Plot | Mito | Lyso or Perox | ER | Golgi | PM | Cytosol | Nucleus | ||||||
| Expt B |
4 peptides |
6 spectra |
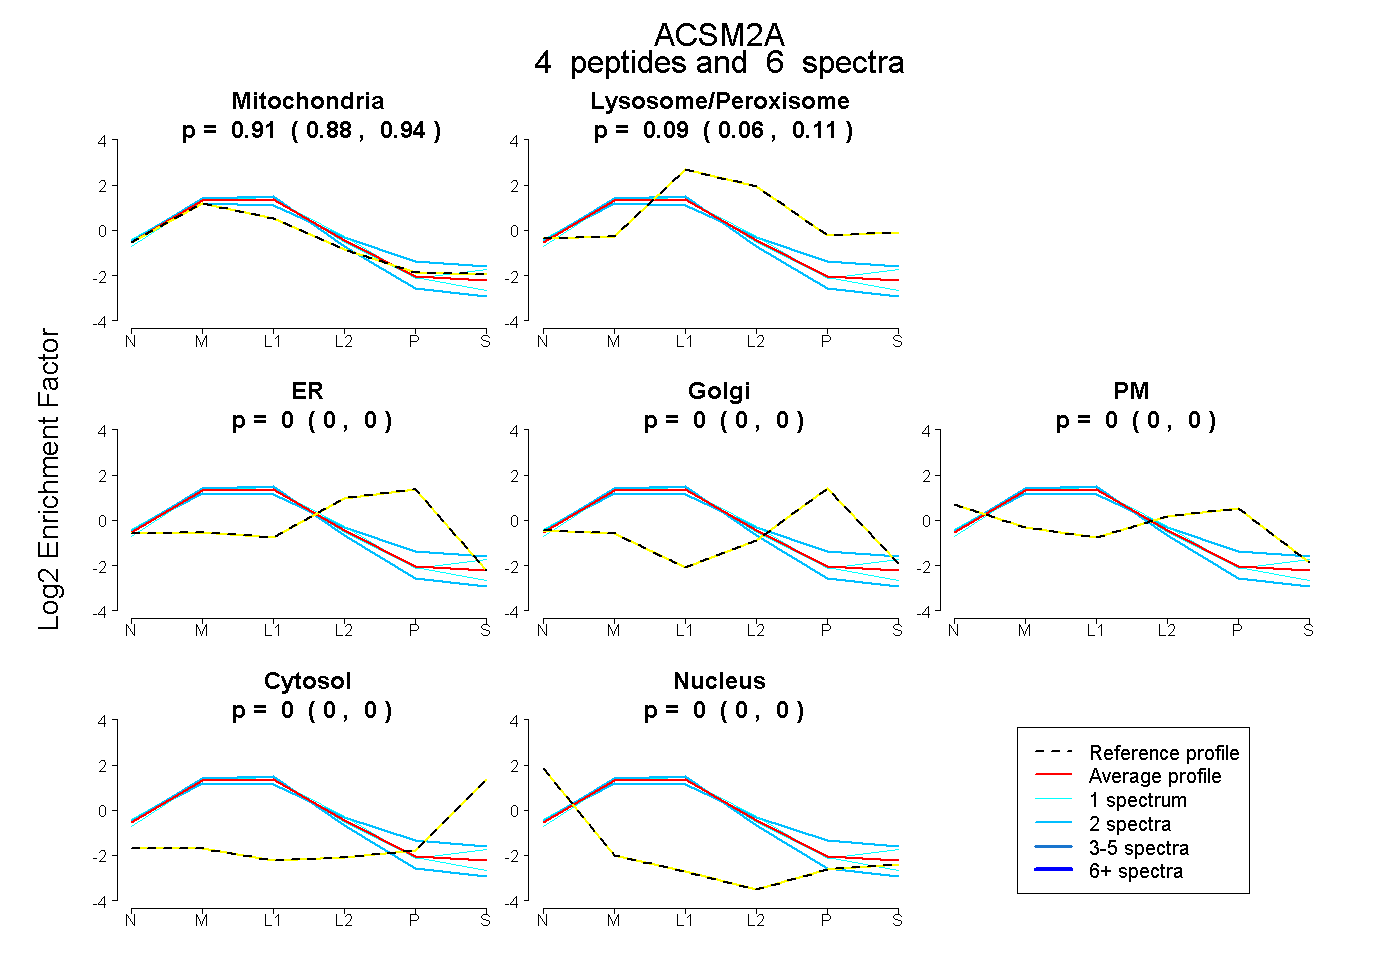 |
0.913 0.881 | 0.940 |
0.087 0.056 | 0.113 |
0.000 0.000 | 0.000 |
0.000 0.000 | 0.000 |
0.000 0.000 | 0.000 |
0.000 0.000 | 0.000 |
0.000 0.000 | 0.000 |
|||
| Plot | Lyso | Other | |||||||||||
| Expt C |
13 peptides |
92 spectra |
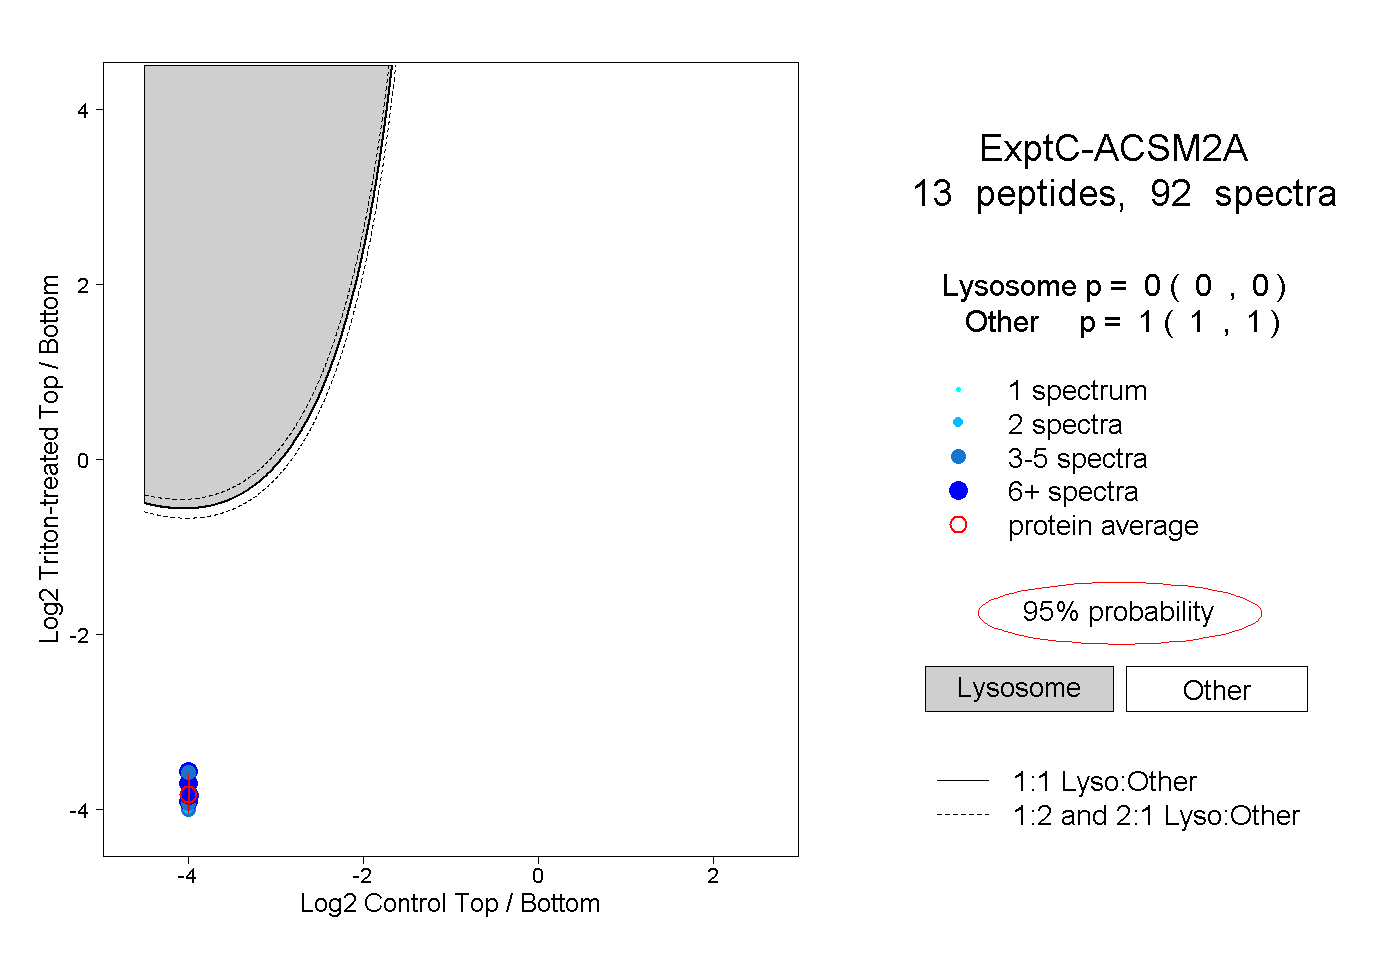 |
0.000 0.000 | 0.000 |
1.000 1.000 | 1.000 |
||||||||
| Plot | Lyso | Other | |||||||||||
| Expt D |
3 peptides |
6 spectra |
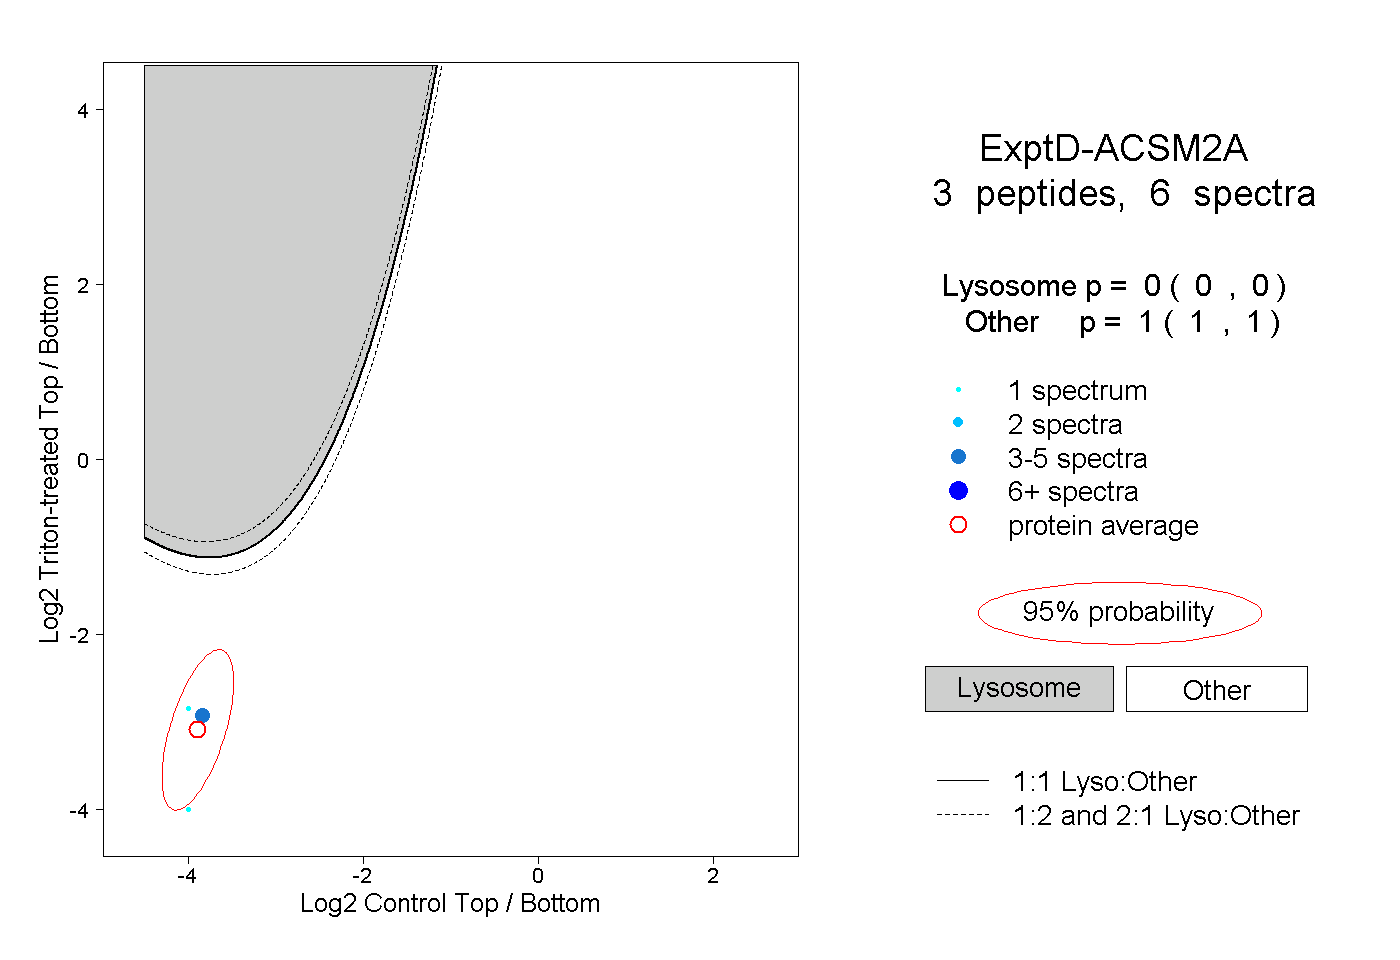 |
0.000 0.000 | 0.000 |
1.000 1.000 | 1.000 |