 11
11peptides
spectra
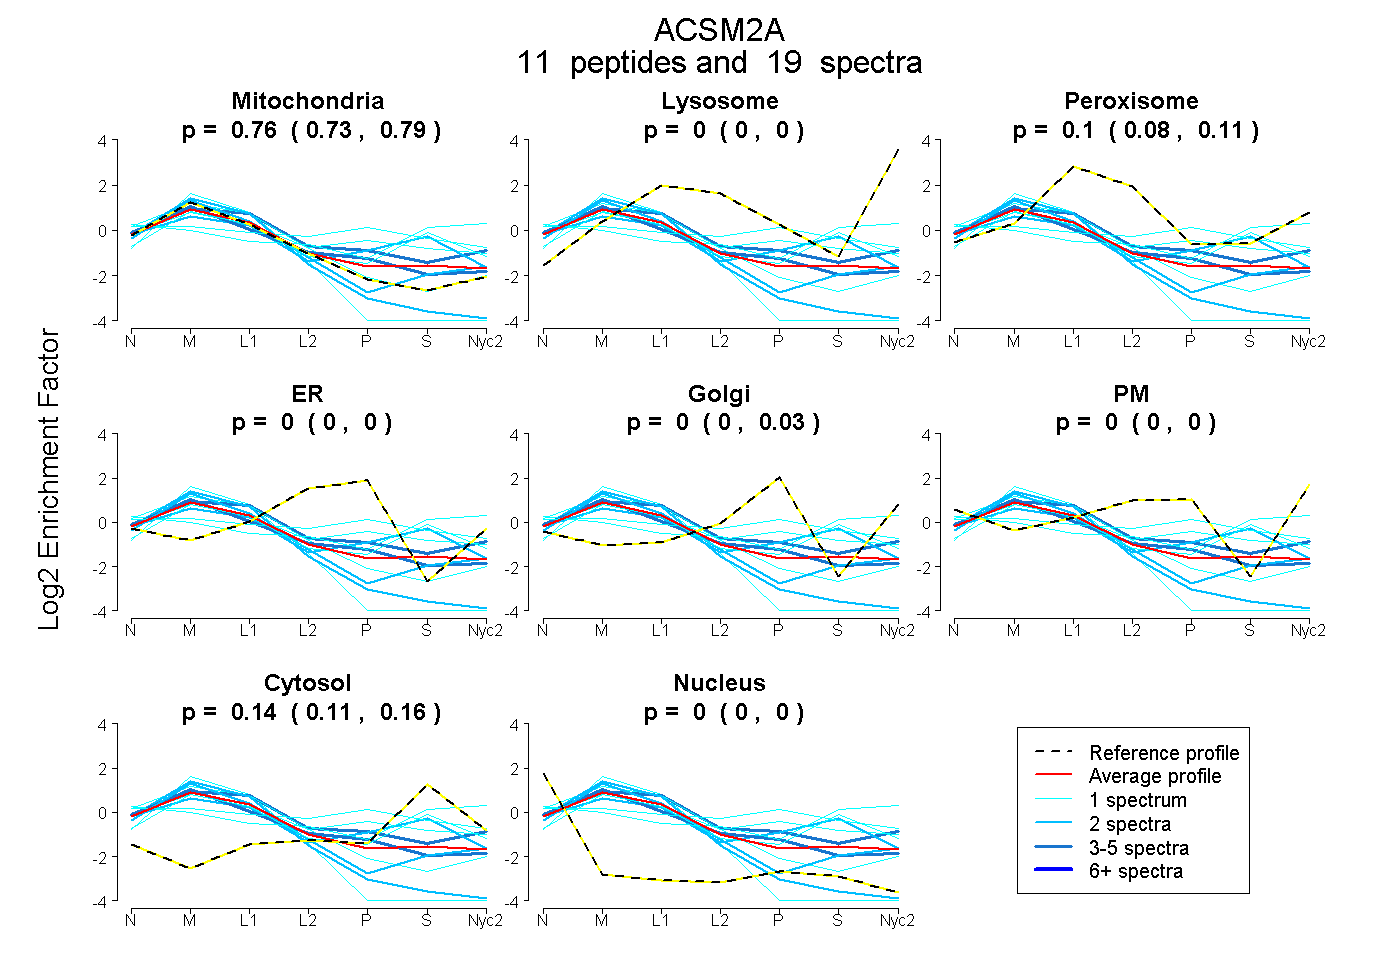
0.728 | 0.786
0.000 | 0.000
0.075 | 0.110
0.000 | 0.000
0.000 | 0.030
0.000 | 0.000
0.112 | 0.158
0.000 | 0.000
4peptides
spectra
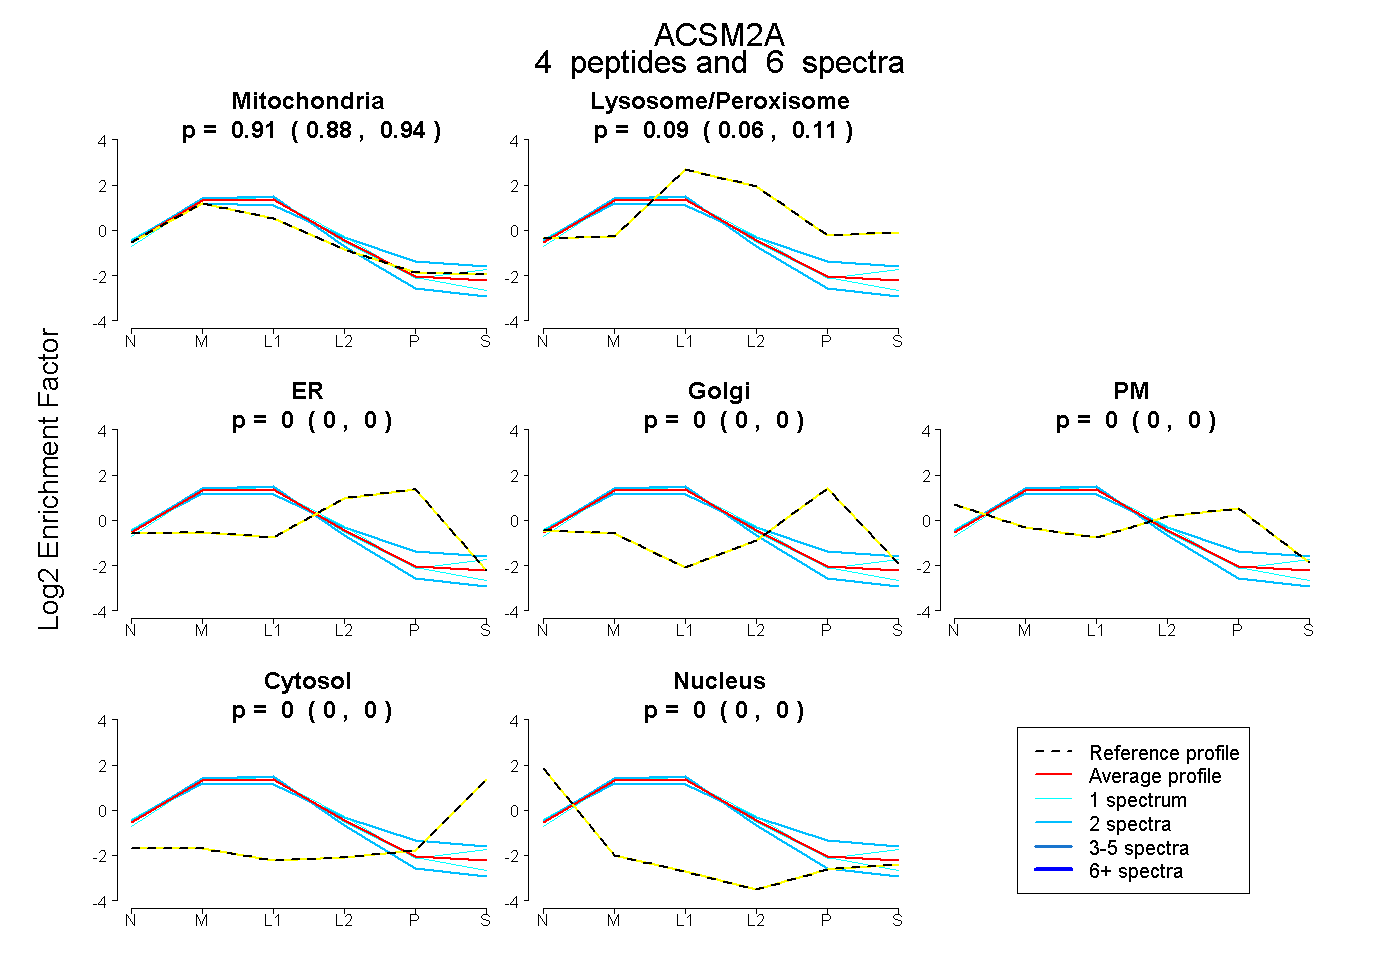
0.881 | 0.940
0.056 | 0.113
0.000 | 0.000
0.000 | 0.000
0.000 | 0.000
0.000 | 0.000
0.000 | 0.000
13peptides
spectra
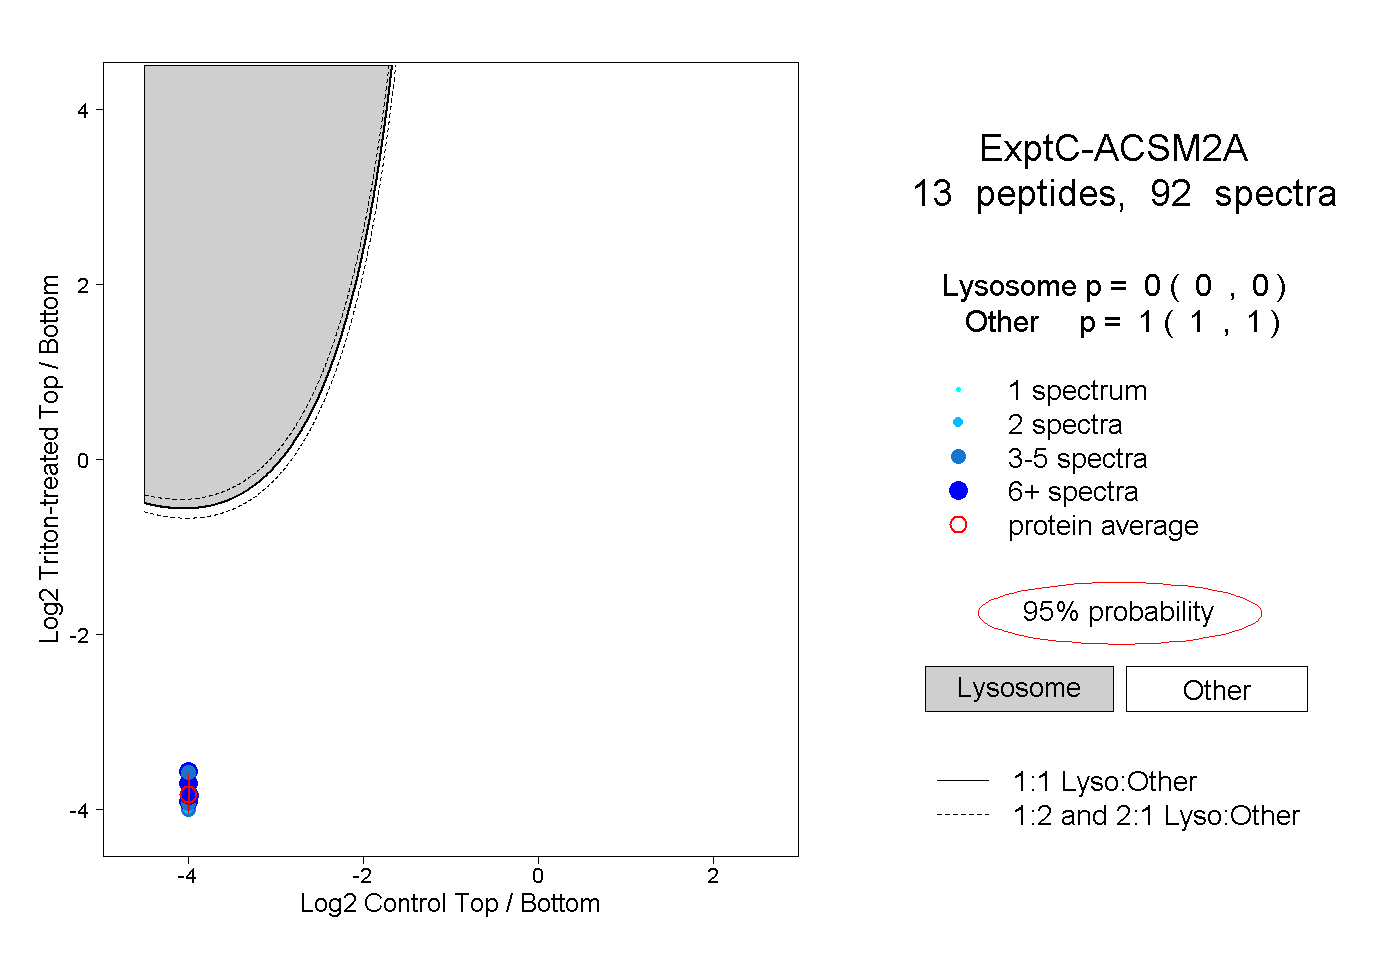
0.000 | 0.000
1.000 | 1.000
3peptides
spectra
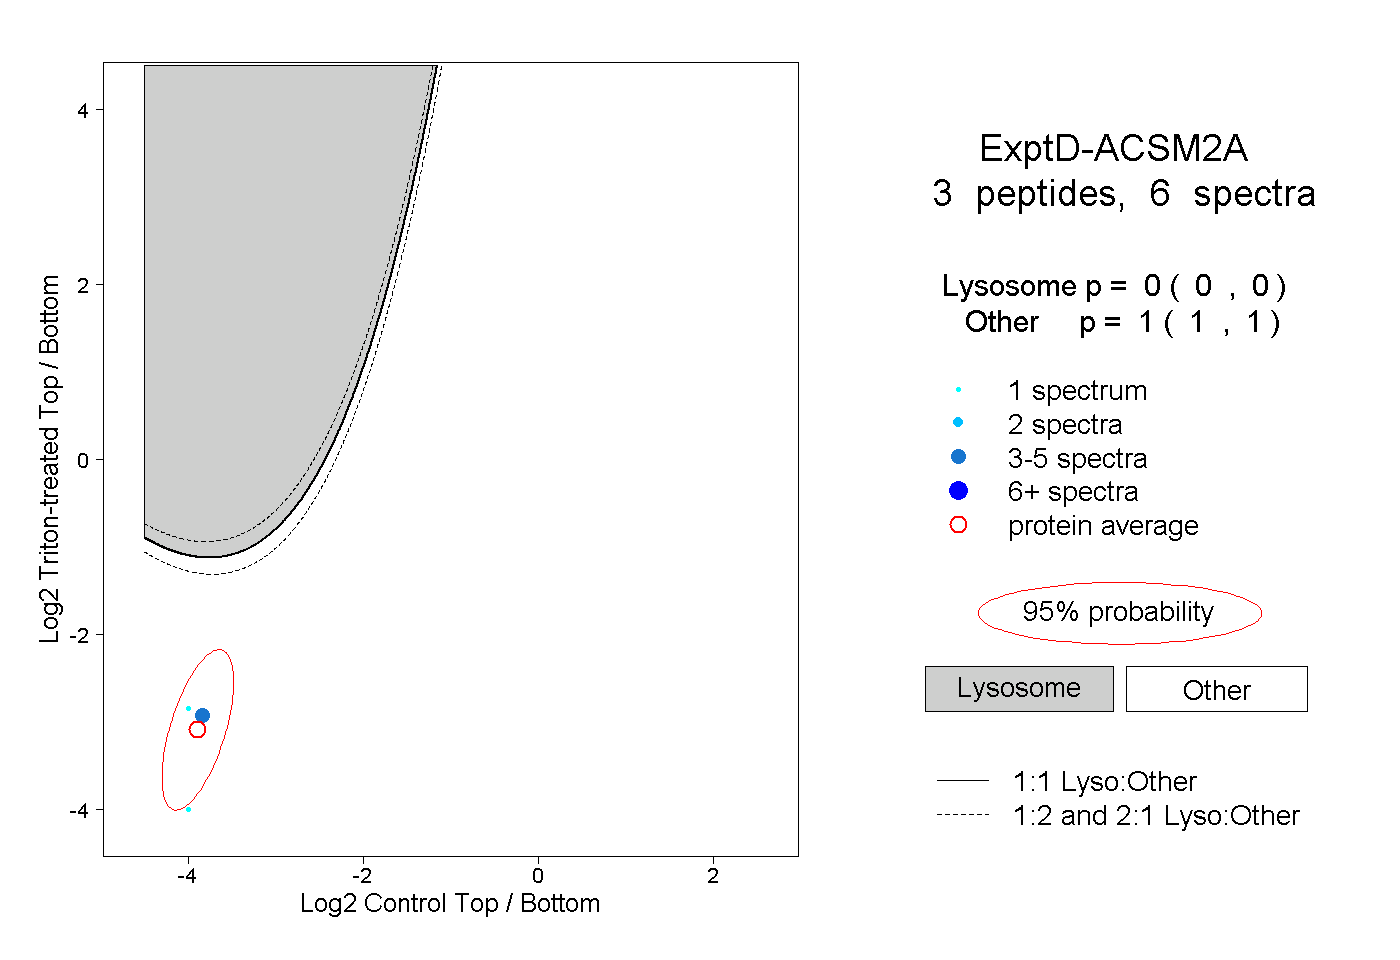
0.000 | 0.000
1.000 | 1.000