 1
1peptide
spectrum
NA | NA
NA | NA
NA | NA
NA | NA
NA | NA
NA | NA
NA | NA
NA | NA
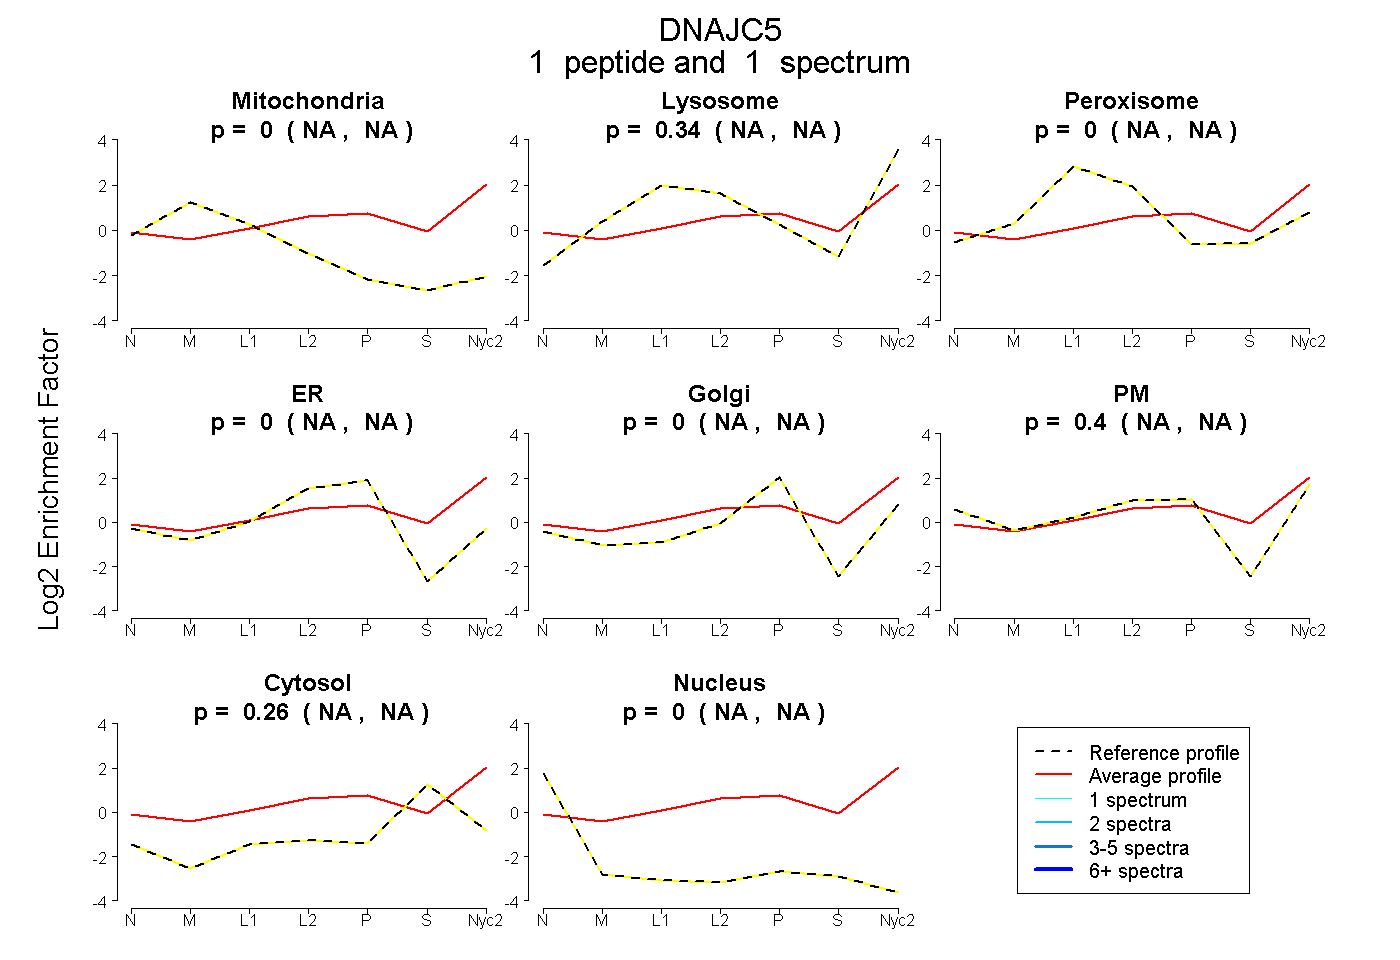
| Plot | Mito | Lyso | Perox | ER | Golgi | PM | Cytosol | Nucleus | |||||
| Expt A |
1 peptide |
1 spectrum |
|
0.000 NA | NA |
0.341 NA | NA |
0.000 NA | NA |
0.000 NA | NA |
0.000 NA | NA |
0.398 NA | NA |
0.261 NA | NA |
0.000 NA | NA |
| 1 spectrum, NPDNPEAADK | 0.000 | 0.341 | 0.000 | 0.000 | 0.000 | 0.398 | 0.261 | 0.000 |
| Plot | Lyso | Other | |||||||||||
| Expt C |
3 peptides |
17 spectra |
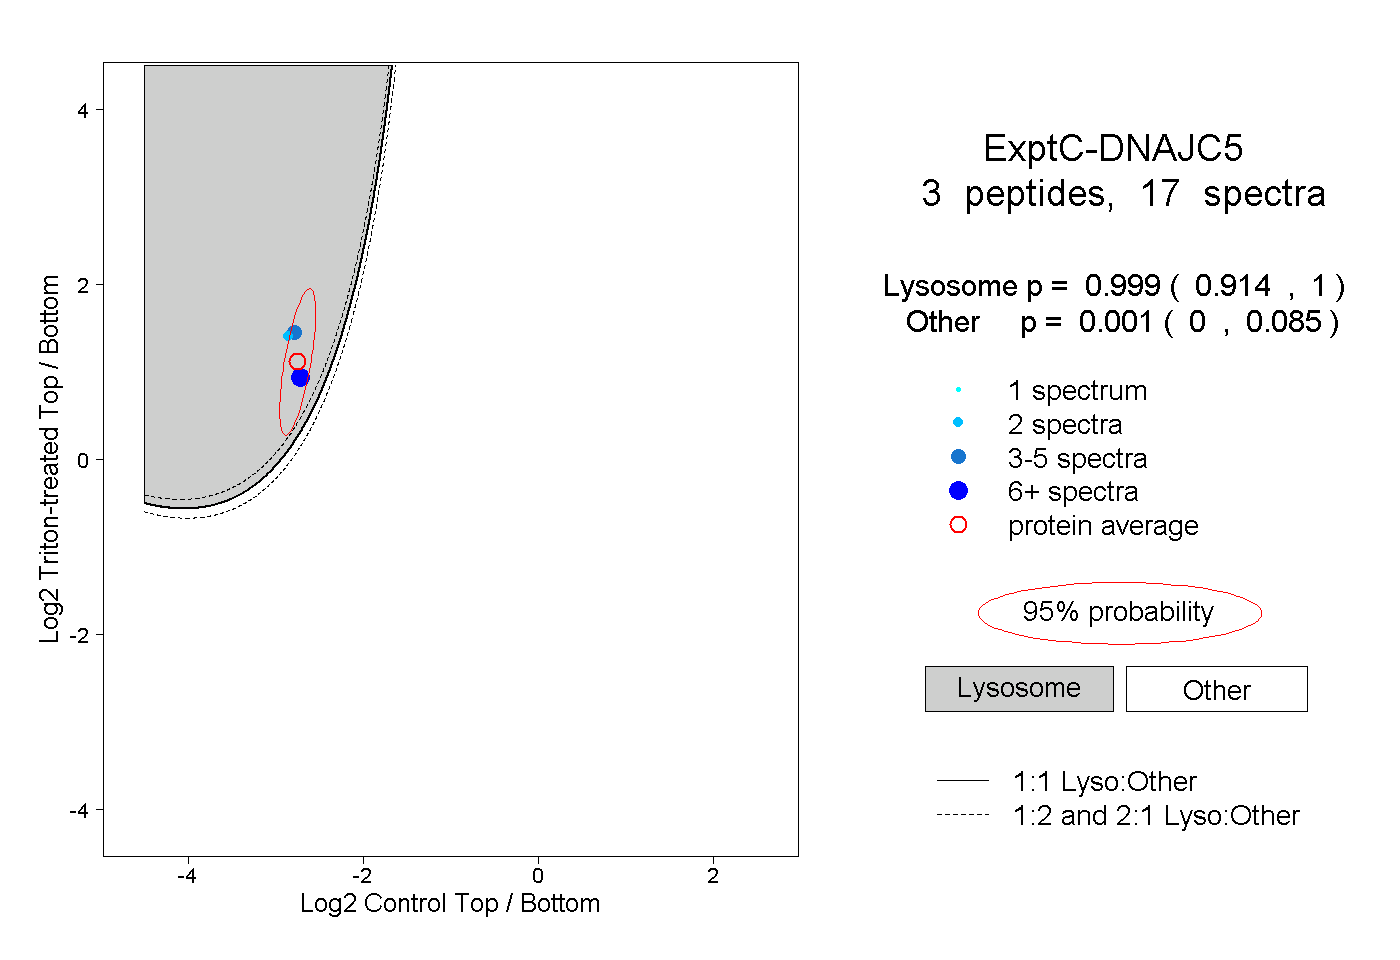 |
0.999 0.914 | 1.000 |
0.001 0.000 | 0.085 |