 7
7peptides
spectra
0.000 | 0.000
0.000 | 0.000
0.000 | 0.000
0.333 | 0.395
0.000 | 0.000
0.311 | 0.378
0.179 | 0.212
0.079 | 0.100
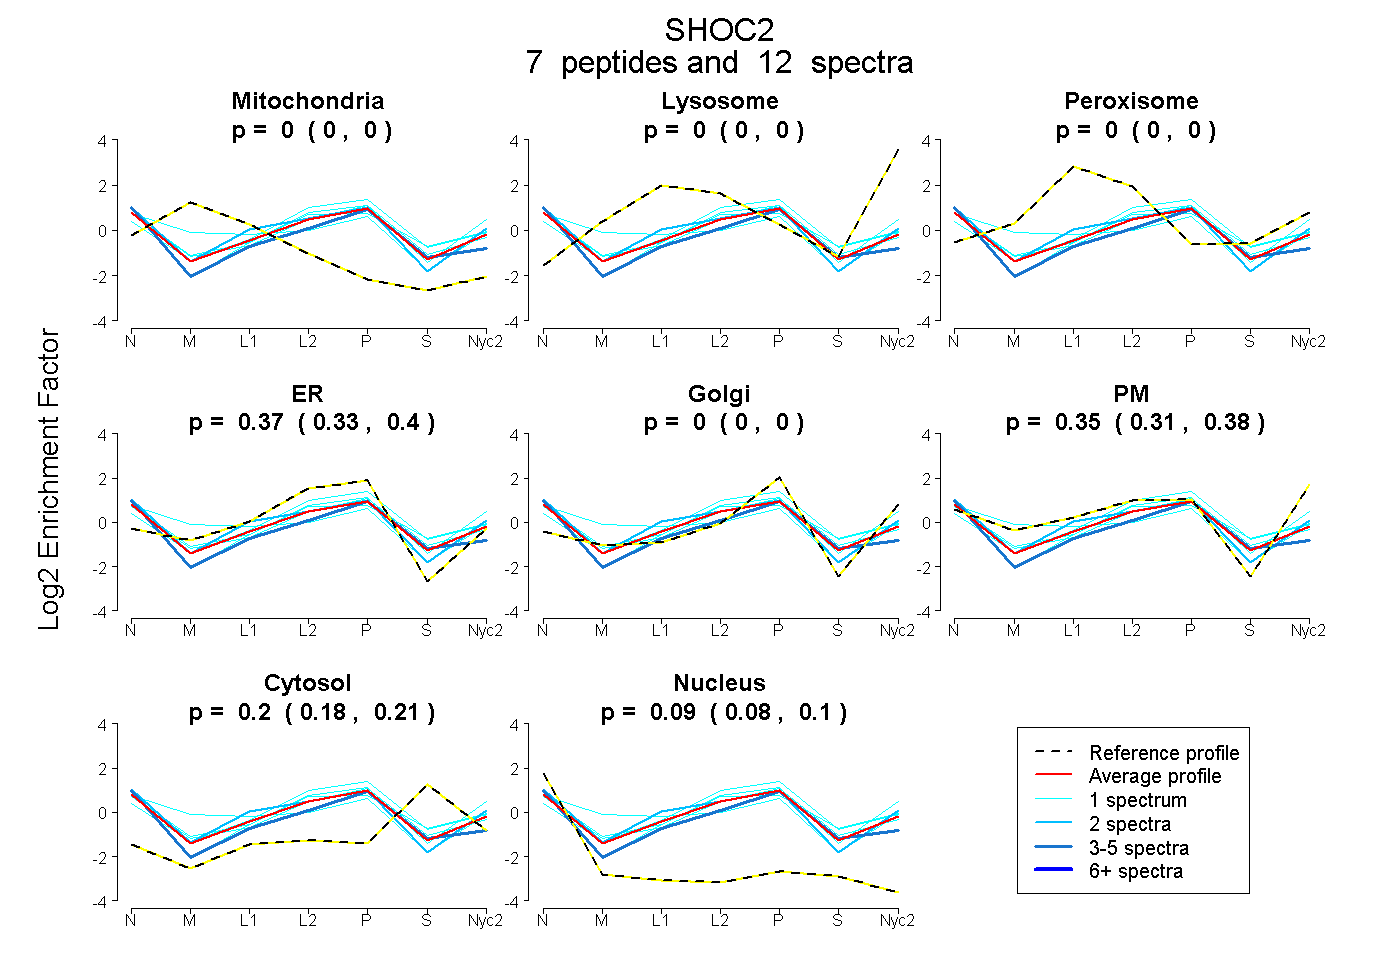
| Plot | Mito | Lyso | Perox | ER | Golgi | PM | Cytosol | Nucleus | |||||
| Expt A |
7 peptides |
12 spectra |
|
0.000 0.000 | 0.000 |
0.000 0.000 | 0.000 |
0.000 0.000 | 0.000 |
0.367 0.333 | 0.395 |
0.000 0.000 | 0.000 |
0.347 0.311 | 0.378 |
0.196 0.179 | 0.212 |
0.090 0.079 | 0.100 |
| 1 spectrum, LNSLTLAR | 0.000 | 0.000 | 0.011 | 0.279 | 0.000 | 0.390 | 0.284 | 0.036 | ||
| 1 spectrum, LPHGLGNLR | 0.000 | 0.000 | 0.000 | 0.425 | 0.000 | 0.273 | 0.225 | 0.077 | ||
| 5 spectra, RPNPALGTR | 0.000 | 0.000 | 0.000 | 0.469 | 0.000 | 0.143 | 0.211 | 0.177 | ||
| 2 spectra, LVLTNNQLTTLPR | 0.000 | 0.000 | 0.042 | 0.304 | 0.000 | 0.459 | 0.068 | 0.127 | ||
| 1 spectrum, LSAIPR | 0.000 | 0.000 | 0.000 | 0.249 | 0.021 | 0.481 | 0.182 | 0.067 | ||
| 1 spectrum, ELTQLTELYLYSNK | 0.179 | 0.000 | 0.045 | 0.082 | 0.145 | 0.431 | 0.037 | 0.082 | ||
| 1 spectrum, IPFGIFSR | 0.000 | 0.000 | 0.000 | 0.536 | 0.000 | 0.198 | 0.266 | 0.000 |
| Plot | Mito | Lyso or Perox | ER | Golgi | PM | Cytosol | Nucleus | ||||||
| Expt B |
1 peptide |
1 spectrum |
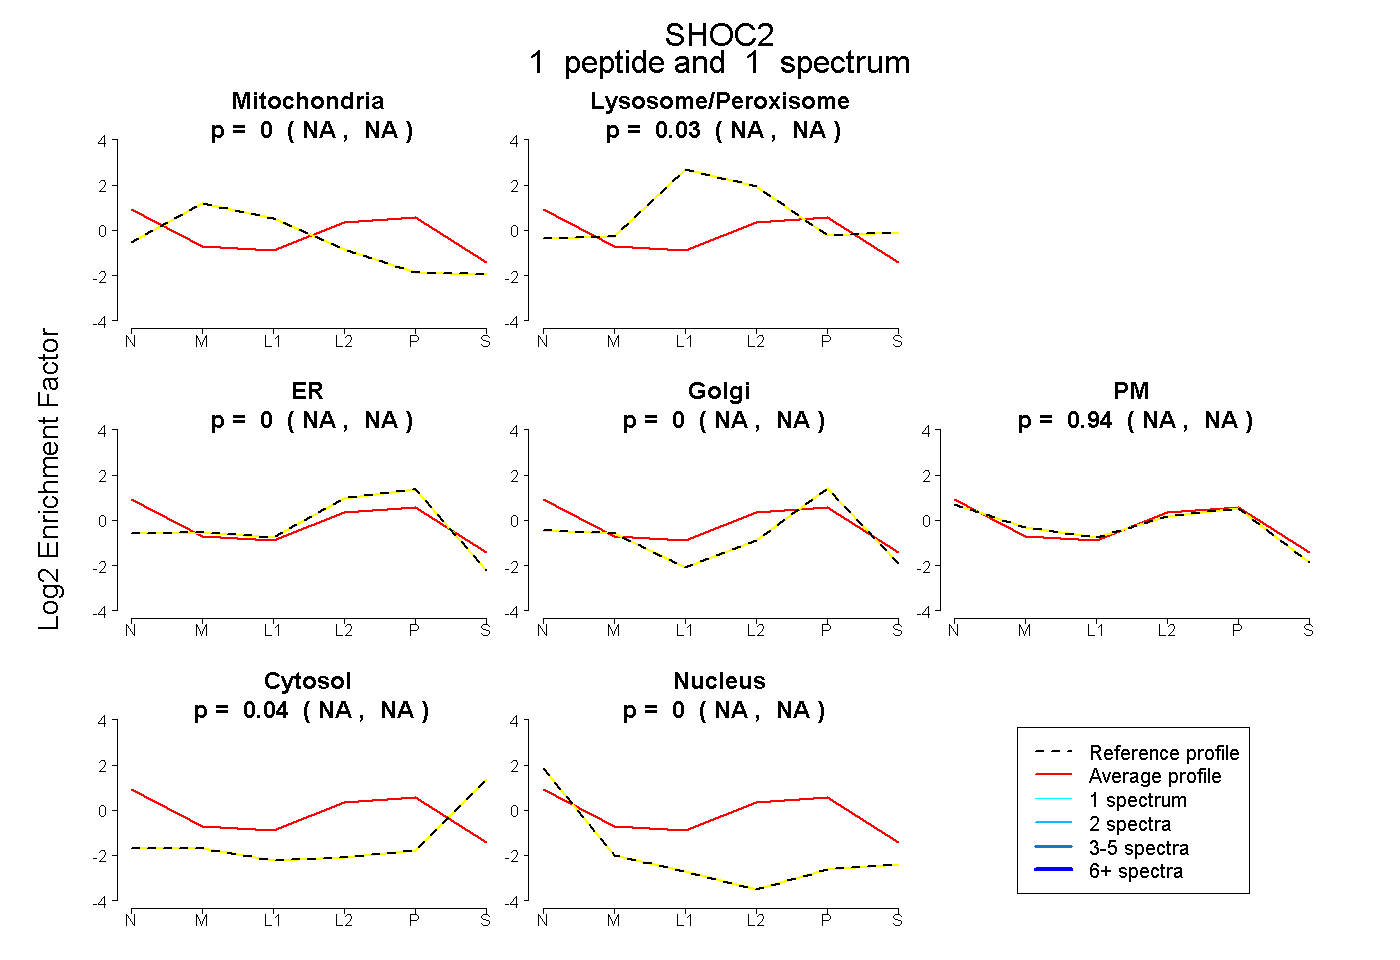 |
0.000 NA | NA |
0.028 NA | NA |
0.000 NA | NA |
0.000 NA | NA |
0.937 NA | NA |
0.035 NA | NA |
0.000 NA | NA |
|||
| Plot | Lyso | Other | |||||||||||
| Expt C |
6 peptides |
10 spectra |
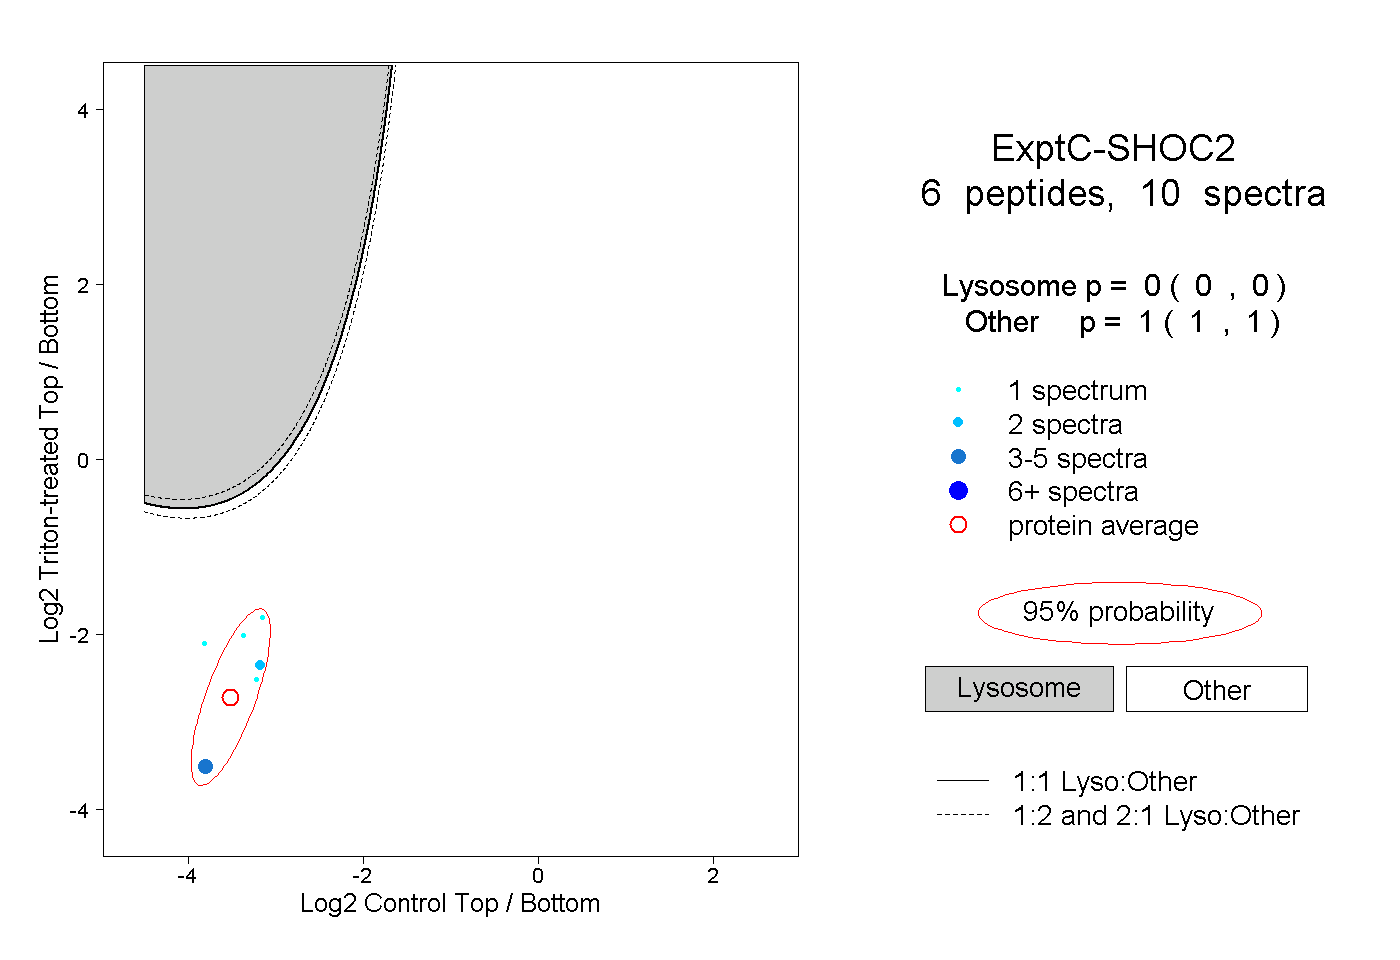 |
0.000 0.000 | 0.000 |
1.000 1.000 | 1.000 |
||||||||
| Plot | Lyso | Other | |||||||||||
| Expt D |
2 peptides |
4 spectra |
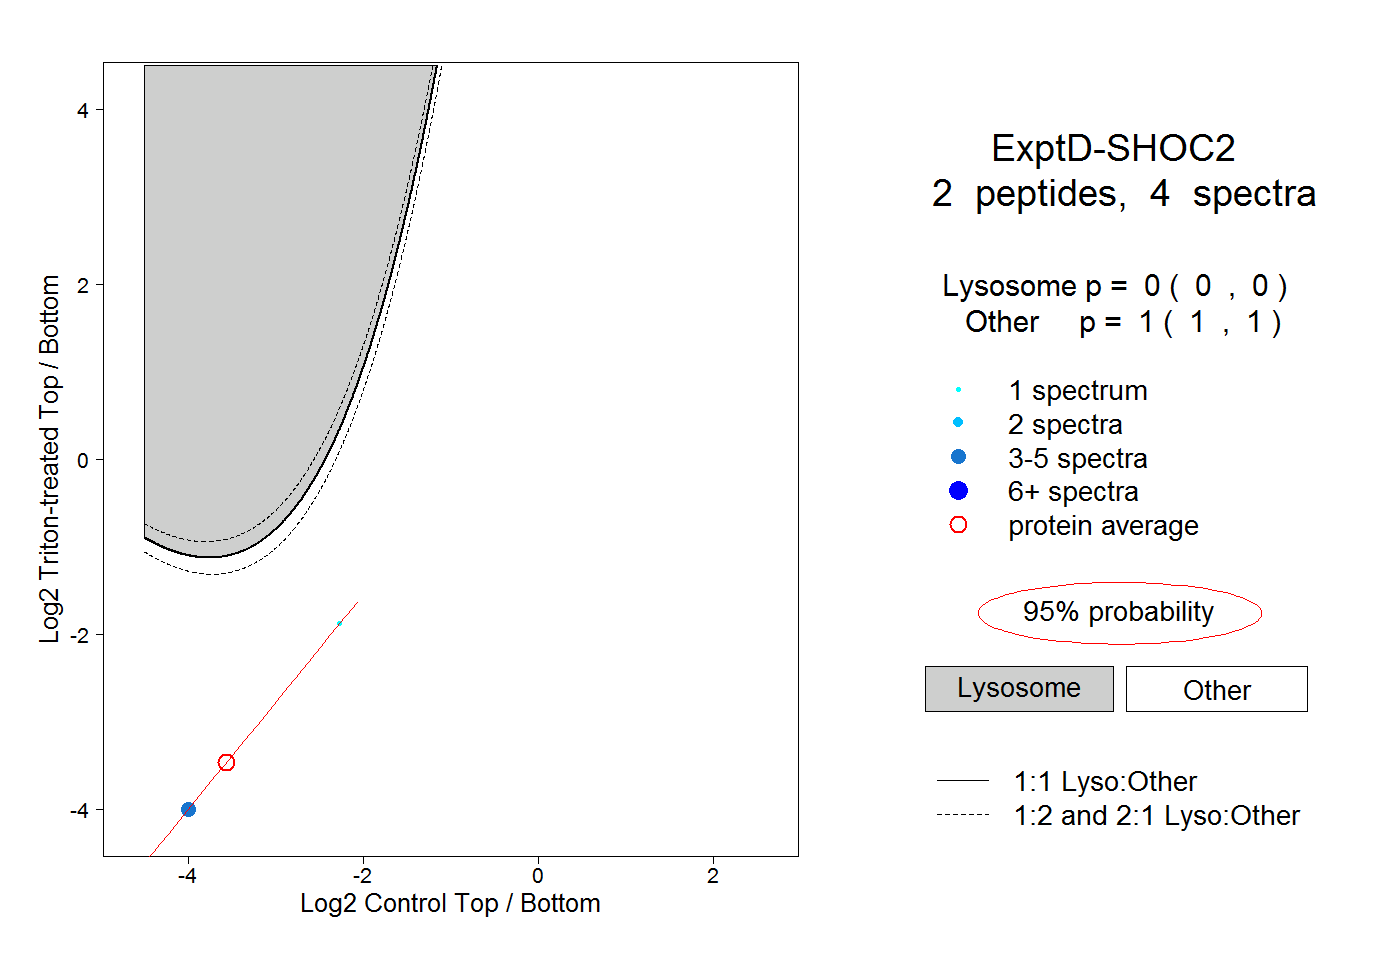 |
0.000 0.000 | 0.000 |
1.000 1.000 | 1.000 |