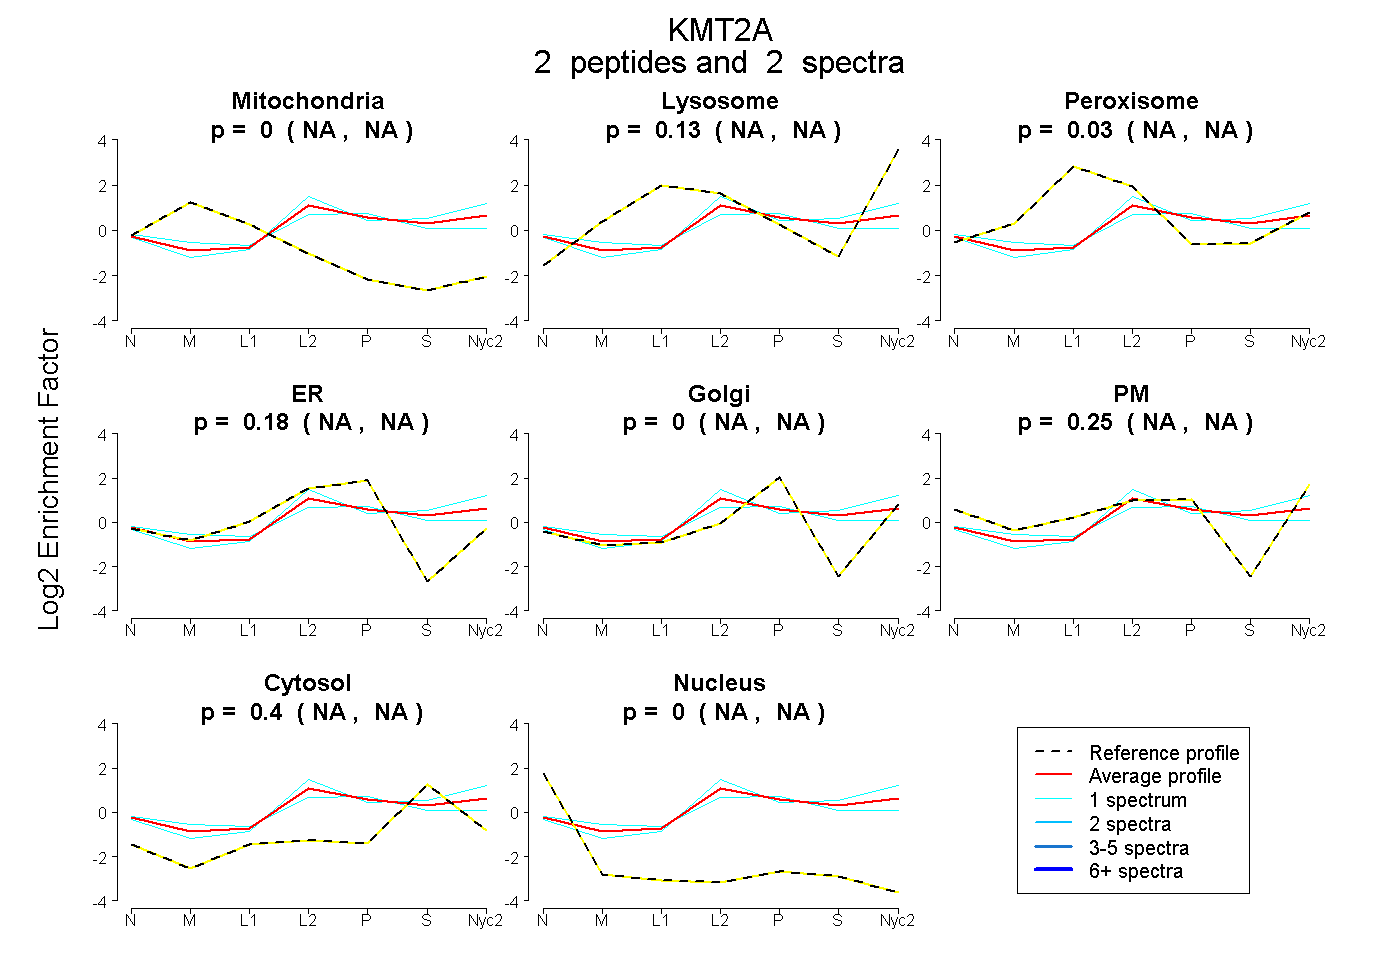
 2
2peptides
spectra
NA | NA
NA | NA
NA | NA
NA | NA
NA | NA
NA | NA
NA | NA
NA | NA
| Plot | Mito | Lyso | Perox | ER | Golgi | PM | Cytosol | Nucleus | |||||
| Expt A |
2 peptides |
2 spectra |
|
0.000 NA | NA |
0.131 NA | NA |
0.034 NA | NA |
0.184 NA | NA |
0.000 NA | NA |
0.246 NA | NA |
0.404 NA | NA |
0.000 NA | NA |
| 1 spectrum, TTSHLLR | 0.000 | 0.000 | 0.109 | 0.259 | 0.000 | 0.244 | 0.388 | 0.000 | ||
| 1 spectrum, ENGTENLK | 0.000 | 0.239 | 0.000 | 0.097 | 0.000 | 0.249 | 0.415 | 0.000 |
| Plot | Lyso | Other | |||||||||||
| Expt C |
1 peptide |
5 spectra |
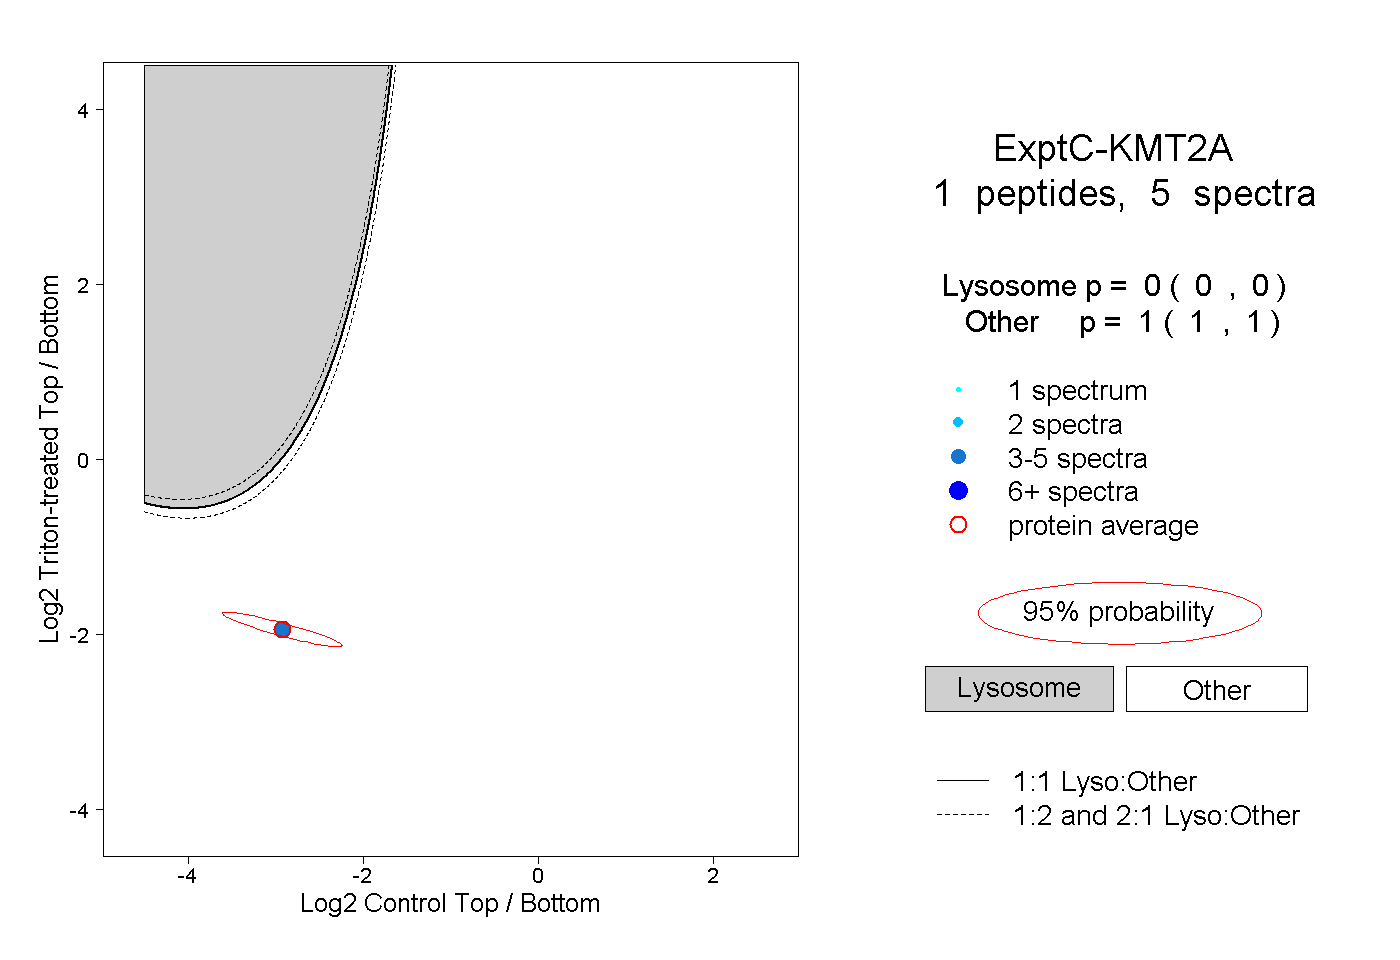 |
0.000 0.000 | 0.000 |
1.000 1.000 | 1.000 |