19
19peptides
spectra
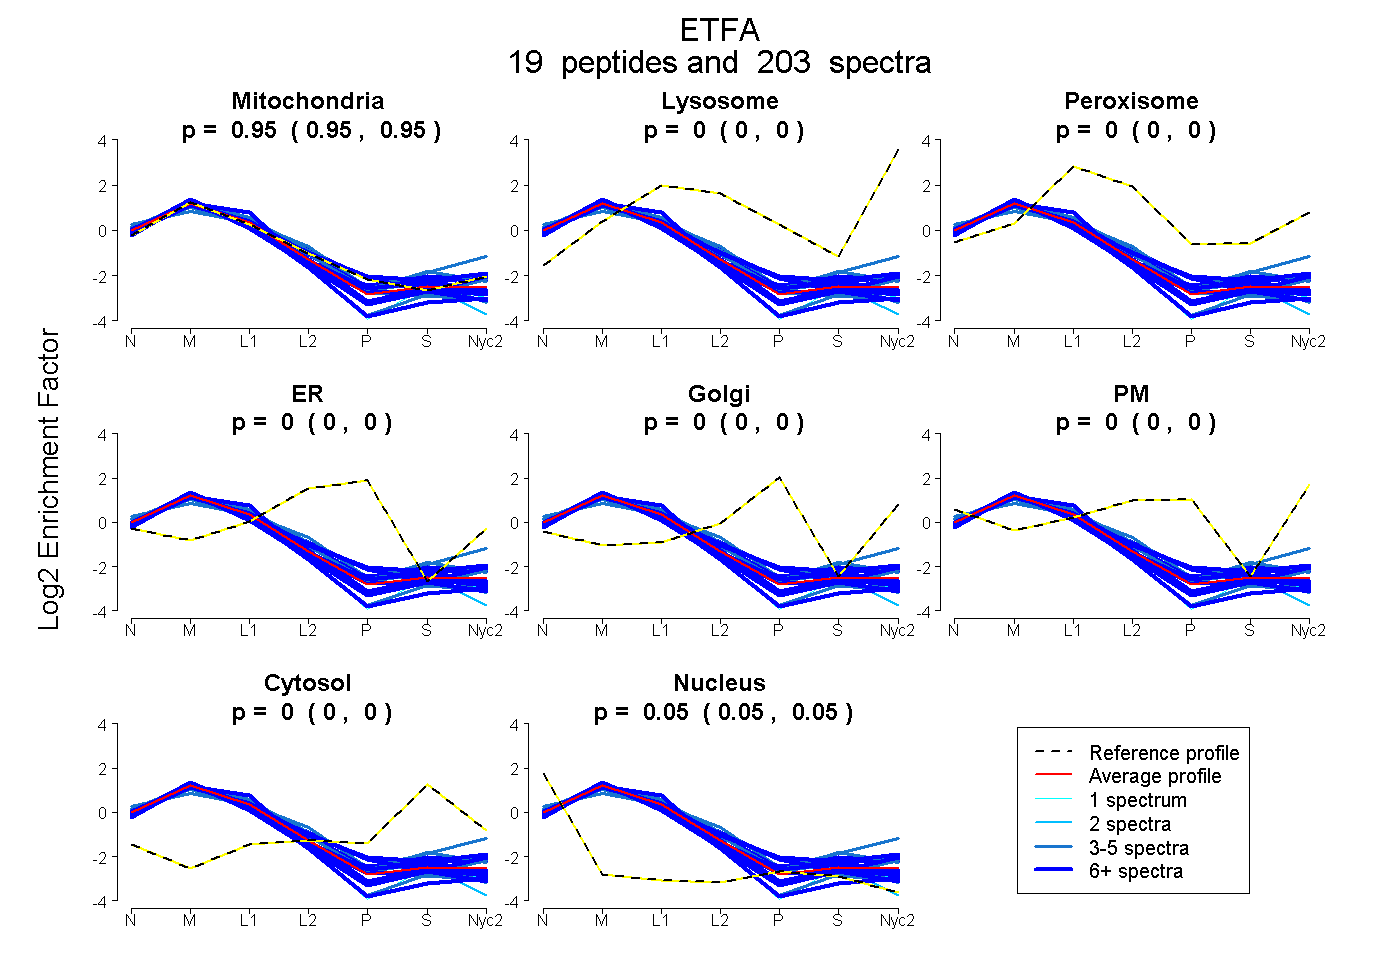
0.948 | 0.950
0.000 | 0.000
0.000 | 0.000
0.000 | 0.000
0.000 | 0.000
0.000 | 0.000
0.000 | 0.000
0.050 | 0.052
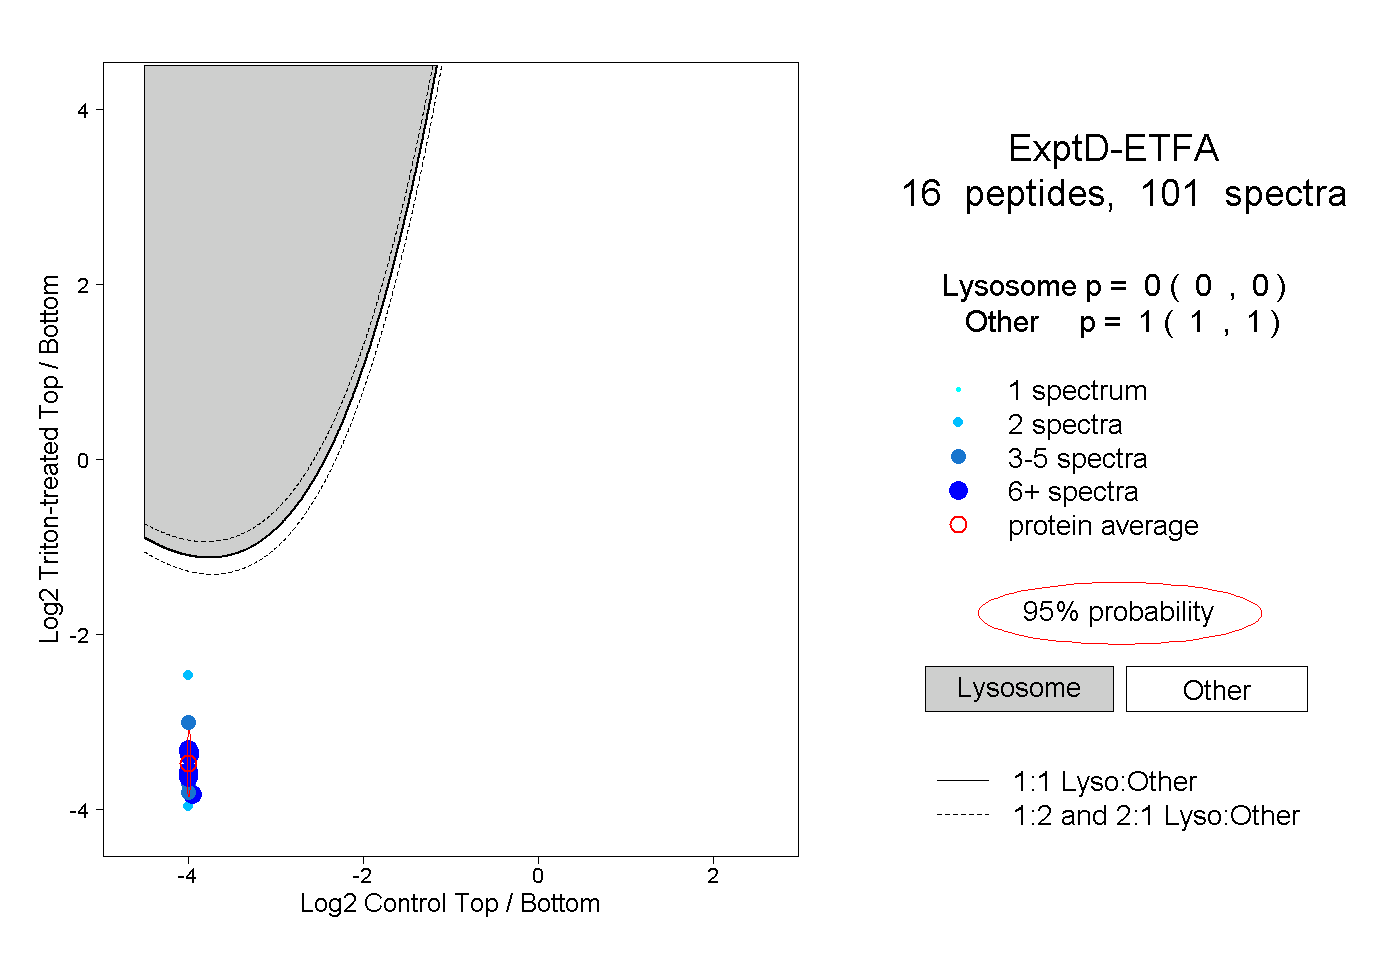
16peptides
spectra
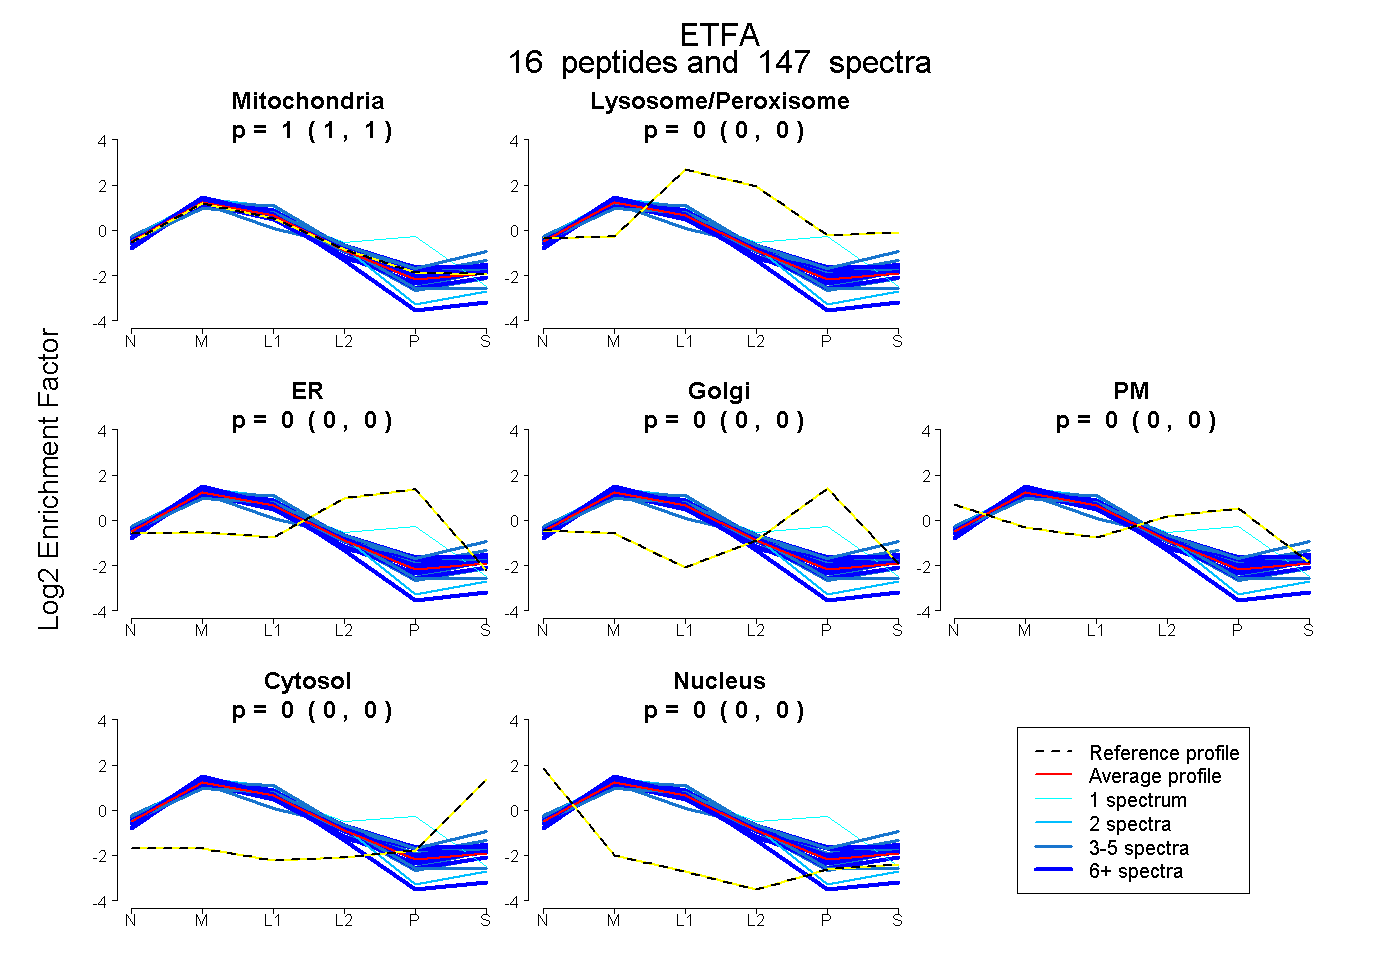
1.000 | 1.000
0.000 | 0.000
0.000 | 0.000
0.000 | 0.000
0.000 | 0.000
0.000 | 0.000
0.000 | 0.000
18peptides
spectra
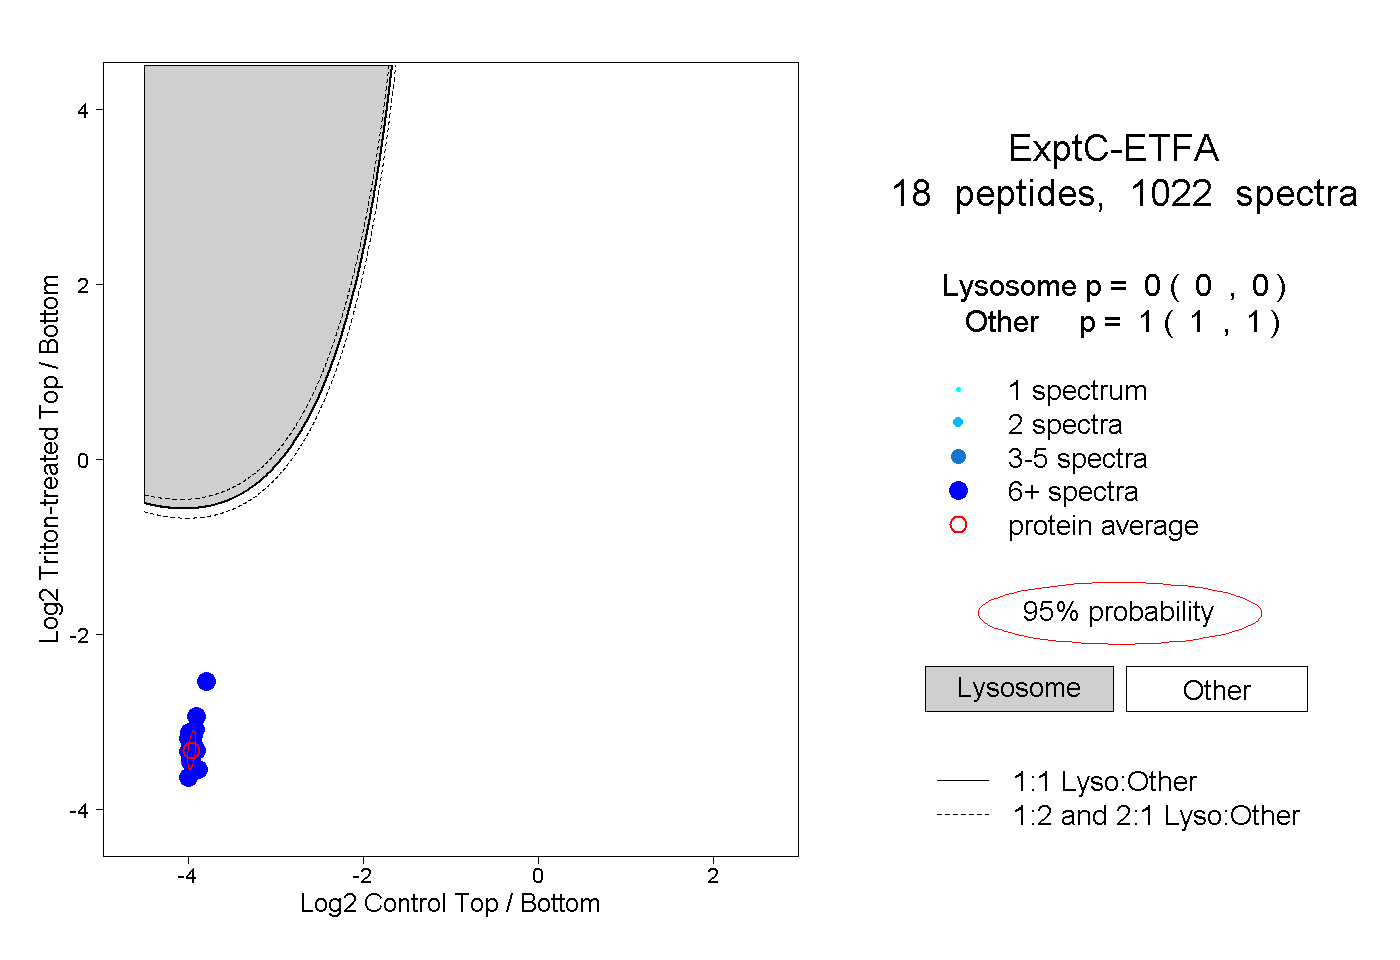
0.000 | 0.000
1.000 | 1.000