| 4 spectra, VVQDLCK |
0.739 |
|
0.164 |
|
0.000 |
0.000 |
0.000 |
0.097 |
0.000 |
|
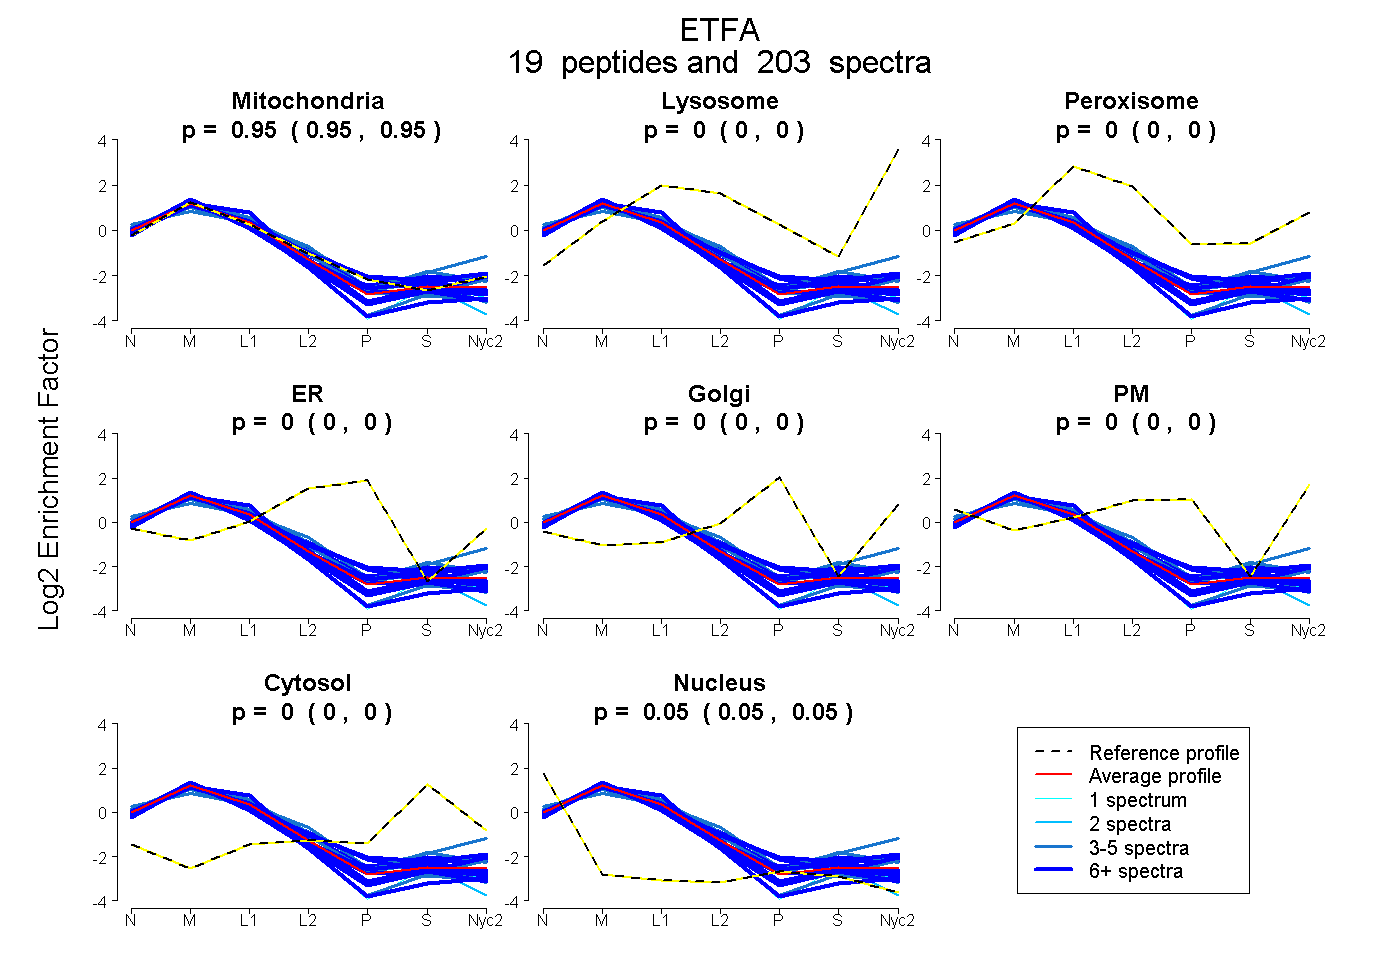
| 19 spectra, VVPEMTEILK |
1.000 |
|
0.000 |
|
0.000 |
0.000 |
0.000 |
0.000 |
0.000 |
|
| 1 spectrum, VAGVAK |
0.684 |
|
0.000 |
|
0.316 |
0.000 |
0.000 |
0.000 |
0.000 |
|
| 3 spectra, LGGEVSCLVAGTK |
0.990 |
|
0.000 |
|
0.000 |
0.000 |
0.000 |
0.000 |
0.010 |
|
| 7 spectra, GLLPEELTPLILETQK |
0.949 |
|
0.000 |
|
0.000 |
0.000 |
0.000 |
0.051 |
0.000 |
|
| 6 spectra, VVVSGGR |
0.954 |
|
0.000 |
|
0.000 |
0.000 |
0.000 |
0.000 |
0.046 |
|
| 2 spectra, TIVAINK |
1.000 |
|
0.000 |
|
0.000 |
0.000 |
0.000 |
0.000 |
0.000 |
|
| 13 spectra, VLVAQHDAYK |
0.887 |
|
0.095 |
|
0.000 |
0.000 |
0.001 |
0.017 |
0.000 |
|
| 4 spectra, APSSSSAGISEWLDQK |
0.934 |
|
0.000 |
|
0.000 |
0.000 |
0.000 |
0.030 |
0.036 |
|
| 4 spectra, SGENFK |
0.918 |
|
0.024 |
|
0.000 |
0.000 |
0.051 |
0.000 |
0.008 |
|
| 7 spectra, SDRPELTGAK |
0.966 |
|
0.000 |
|
0.000 |
0.000 |
0.000 |
0.022 |
0.012 |
|
| 4 spectra, AAVDAGFVPNDMQVGQTGK |
0.882 |
|
0.044 |
|
0.000 |
0.000 |
0.000 |
0.074 |
0.000 |
|
| 24 spectra, SPDTFVR |
0.961 |
|
0.000 |
|
0.000 |
0.000 |
0.000 |
0.005 |
0.034 |
|
| 3 spectra, TIYAGNALCTVK |
1.000 |
|
0.000 |
|
0.000 |
0.000 |
0.000 |
0.000 |
0.000 |
|
| 19 spectra, LNVAPVSDIIEIK |
0.959 |
|
0.012 |
|
0.000 |
0.021 |
0.000 |
0.008 |
0.000 |
|
| 27 spectra, LLYDLADQLHAAVGASR |
1.000 |
|
0.000 |
|
0.000 |
0.000 |
0.000 |
0.000 |
0.000 |
|
 19
19