TNPO1
[ENSRNOP00000020543]
Main page
| | | Plot |
Mito |
Lyso |
|
Perox |
ER |
Golgi |
PM |
Cytosol |
Nucleus |
|
| Expt A |
 15
15
peptides |
40
spectra |
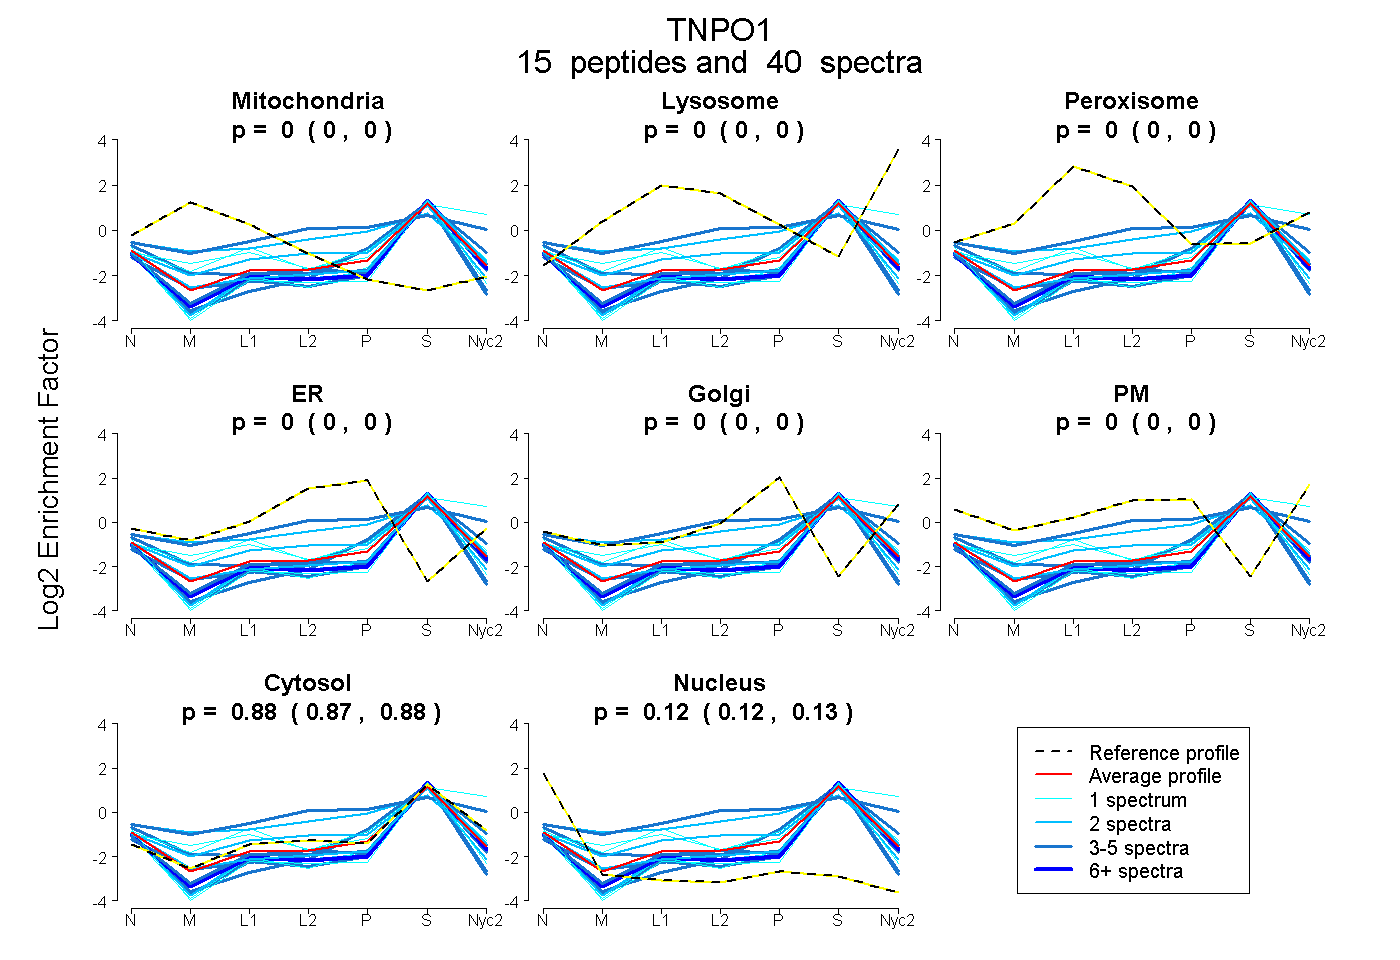 |
0.000
0.000 | 0.000 |
0.000
0.000 | 0.000 |
|
0.000
0.000 | 0.000 |
0.000
0.000 | 0.000 |
0.000
0.000 | 0.000 |
0.000
0.000 | 0.000 |
0.878
0.871 | 0.883 |
0.122
0.115 | 0.128 |
|
| | | Plot |
Mito |
|
Lyso or Perox |
|
ER |
Golgi |
PM |
Cytosol |
Nucleus |
|
| Expt B |
5
peptides |
6
spectra |
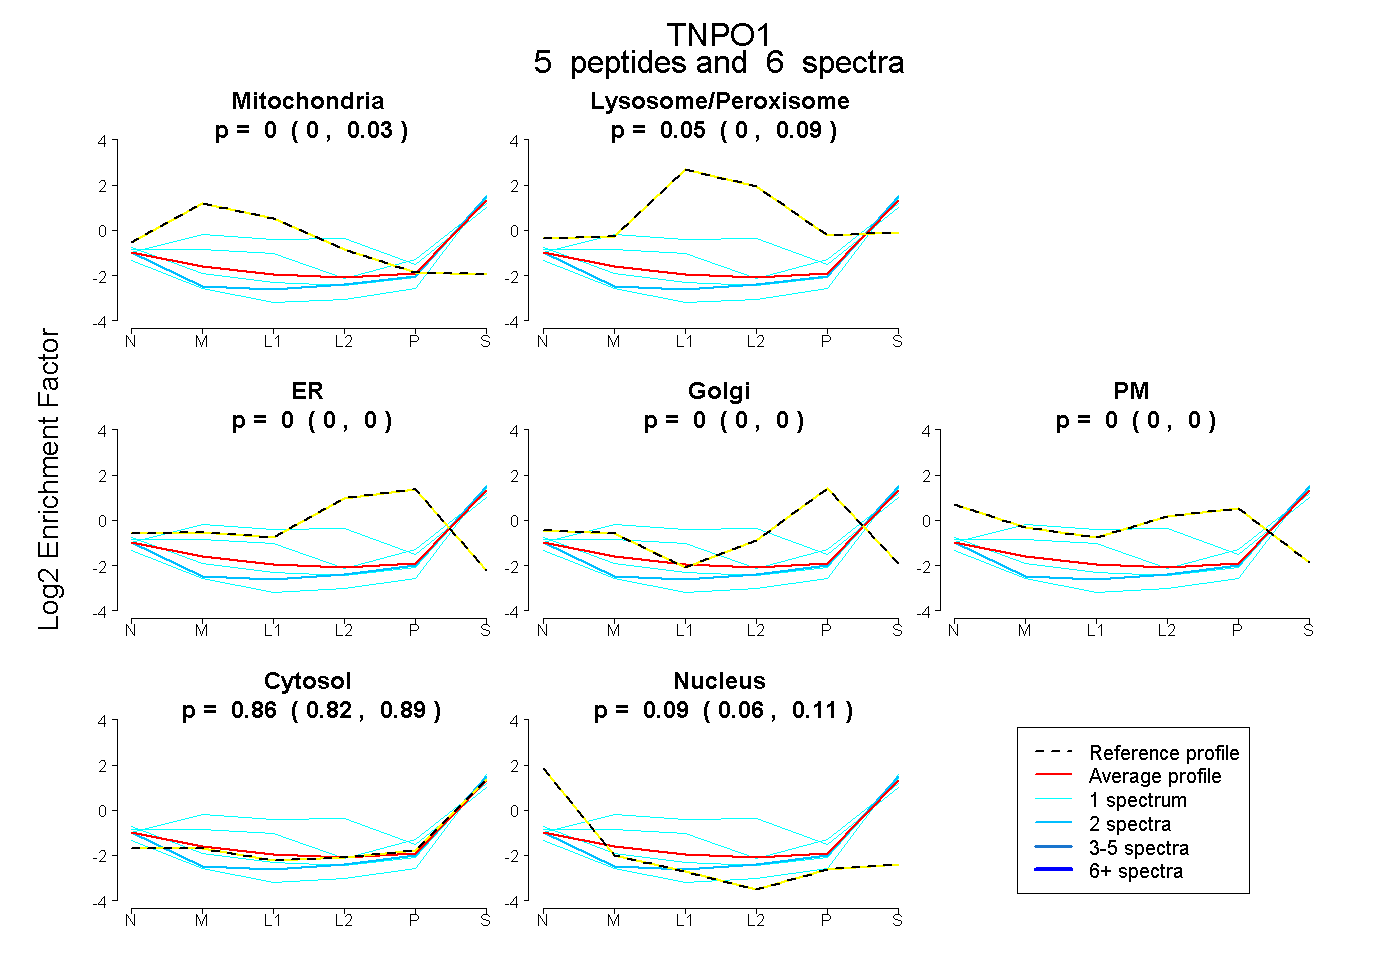 |
0.000
0.000 | 0.031 |
|
0.047
0.000 | 0.091 |
|
0.000
0.000 | 0.000 |
0.000
0.000 | 0.000 |
0.000
0.000 | 0.000 |
0.861
0.822 | 0.891 |
0.091
0.060 | 0.111 |
|
| | | Plot |
|
Lyso |
|
|
|
|
|
|
|
Other |
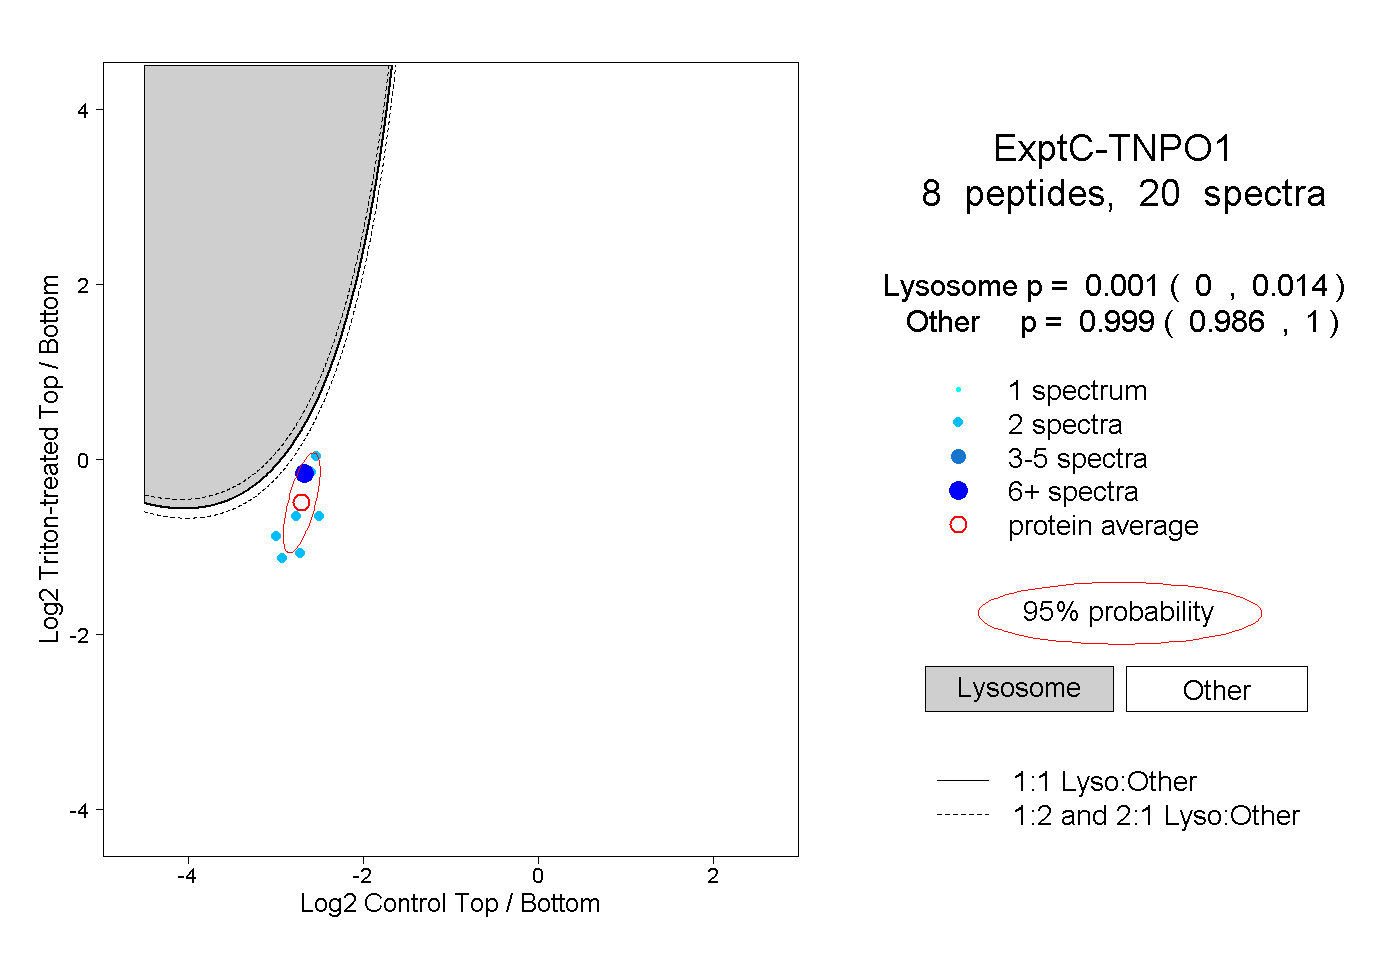
| Expt C |
8
peptides |
20
spectra |
 |
|
0.001
0.000 | 0.014 |
|
|
|
|
|
|
|
0.999
0.986 | 1.000 |
| 2 spectra, SITCWTLSR |
|
0.000 |
|
|
|
|
|
|
|
1.000 |
| 2 spectra, ALVMLLEVR |
|
0.004 |
|
|
|
|
|
|
|
0.996 |
| 2 spectra, NQVGDENWR |
|
0.000 |
|
|
|
|
|
|
|
1.000 |
| 2 spectra, TLLENTAITIGR |
|
0.000 |
|
|
|
|
|
|
|
1.000 |
| 2 spectra, YSDIDIILLK |
|
0.008 |
|
|
|
|
|
|
|
0.992 |
| 6 spectra, ESQSPDTTIQR |
|
0.009 |
|
|
|
|
|
|
|
0.991 |
| 2 spectra, ILHGFK |
|
0.000 |
|
|
|
|
|
|
|
1.000 |
| 2 spectra, SLSGLILK |
|
0.000 |
|
|
|
|
|
|
|
1.000 |
| | | Plot |
|
Lyso |
|
|
|
|
|
|
|
Other |
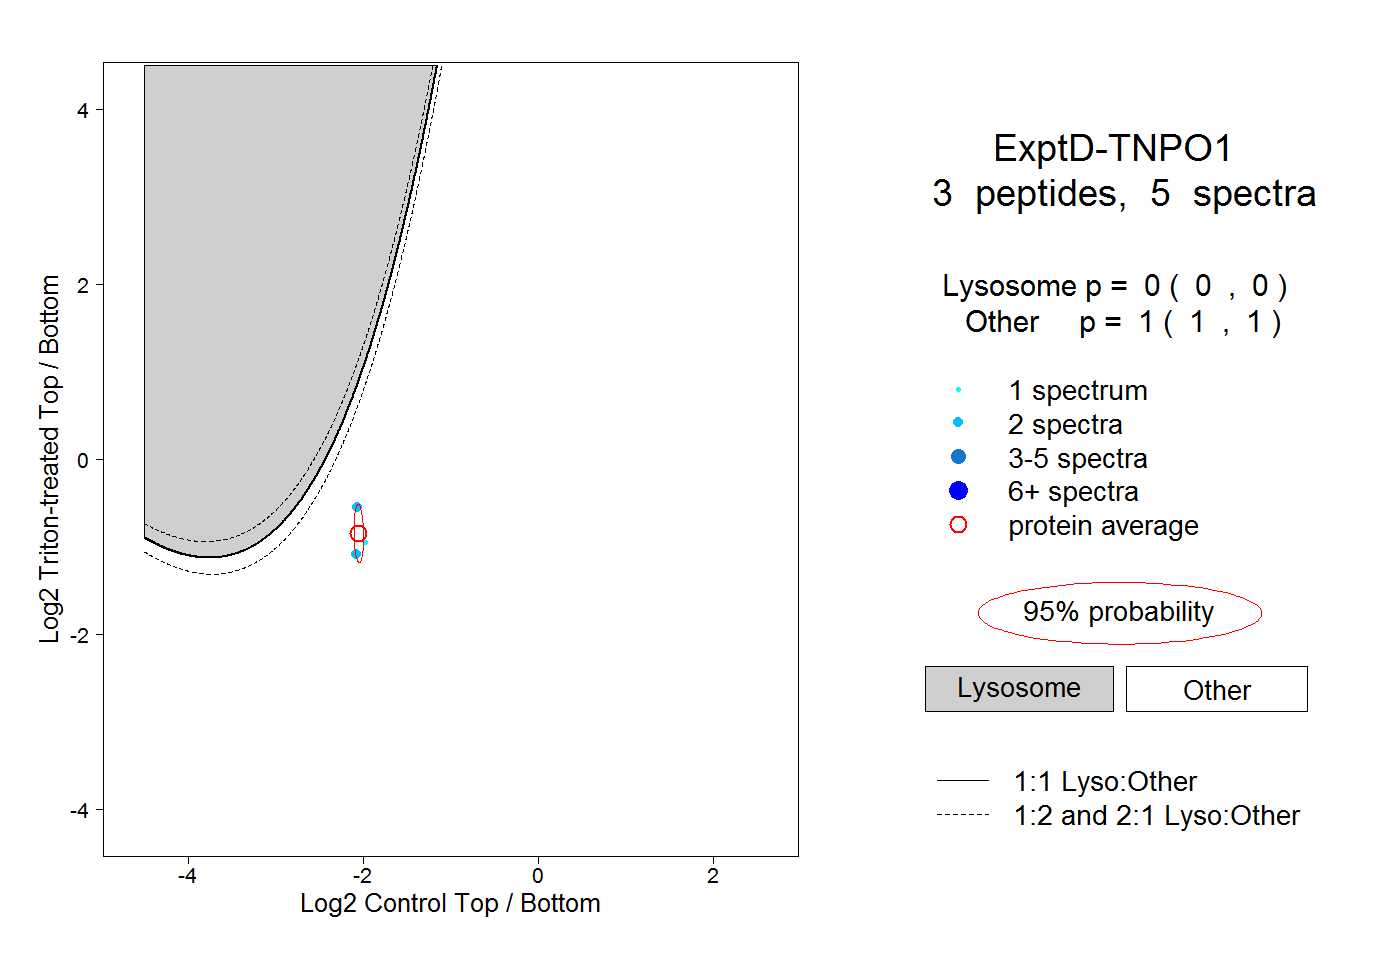
| Expt D |
3
peptides |
5
spectra |
 |
|
0.000
0.000 | 0.000 |
|
|
|
|
|
|
|
1.000
1.000 | 1.000 |