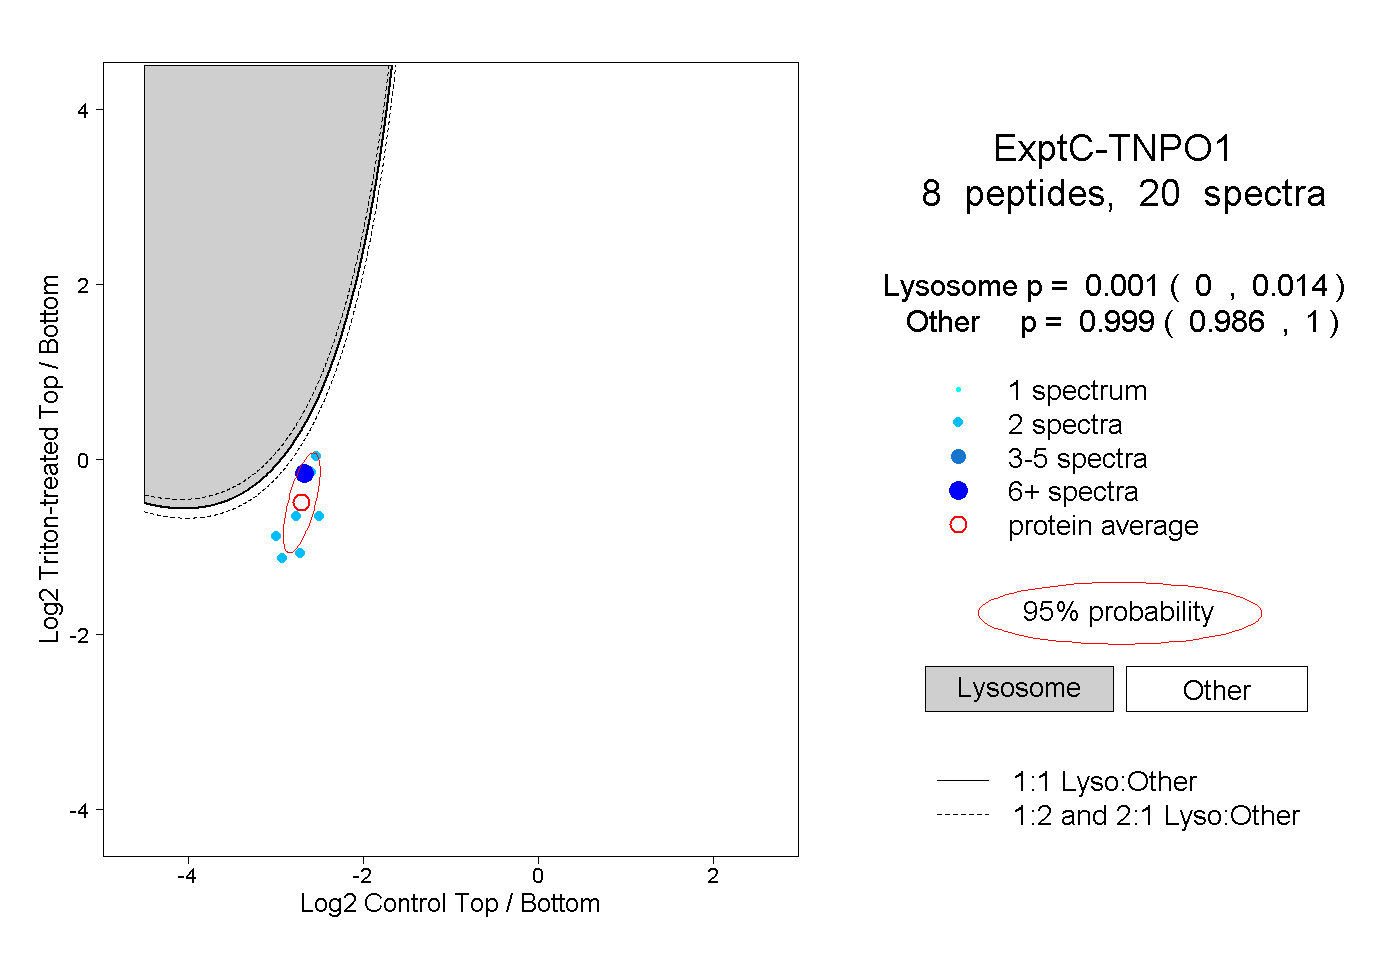
15
15peptides
spectra
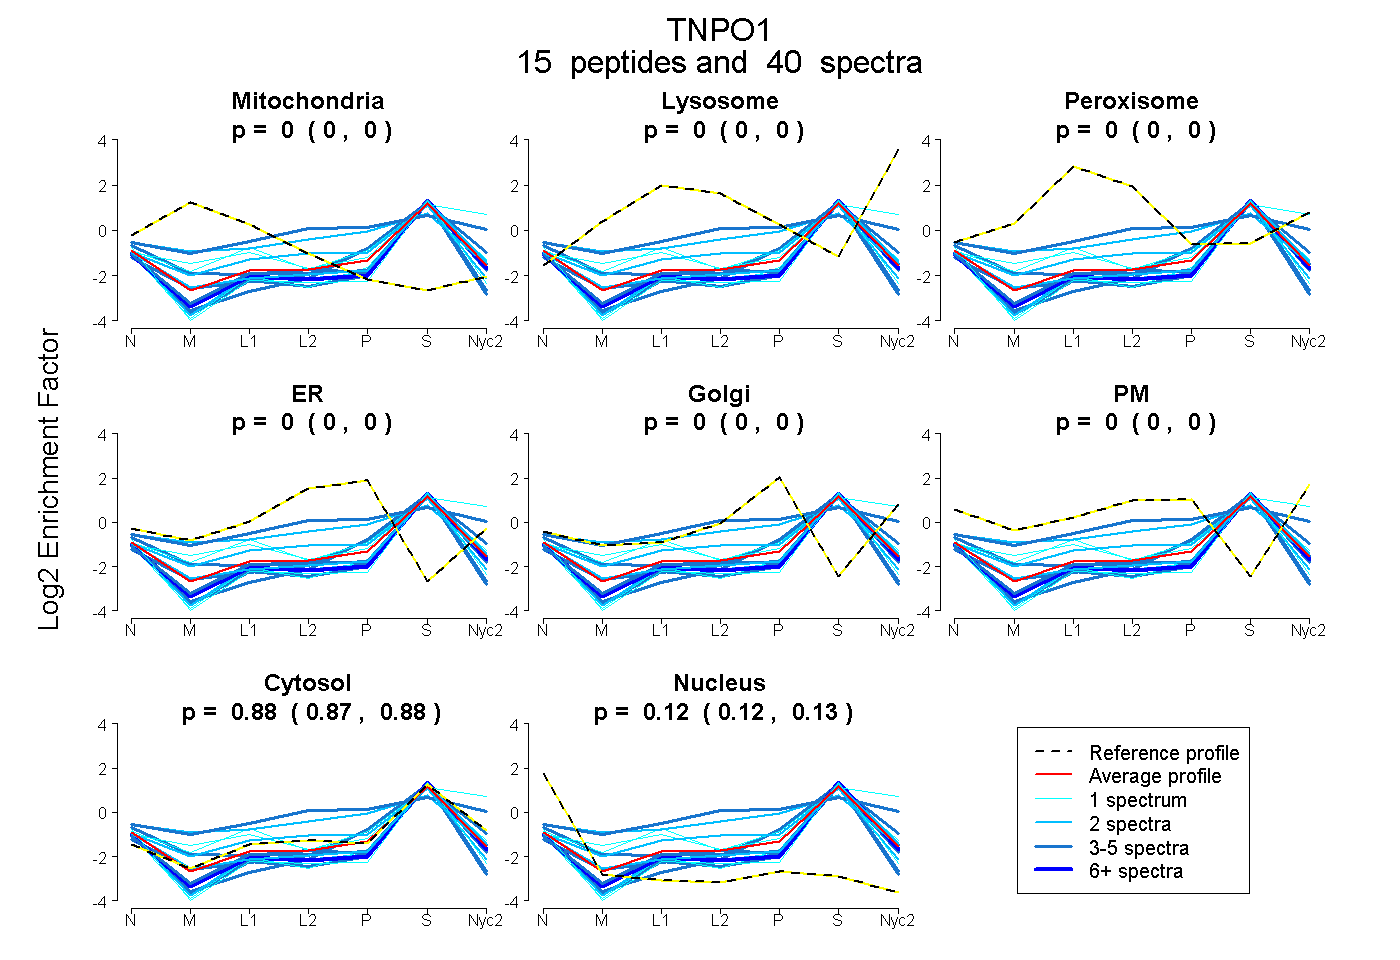
0.000 | 0.000
0.000 | 0.000
0.000 | 0.000
0.000 | 0.000
0.000 | 0.000
0.000 | 0.000
0.871 | 0.883
0.115 | 0.128
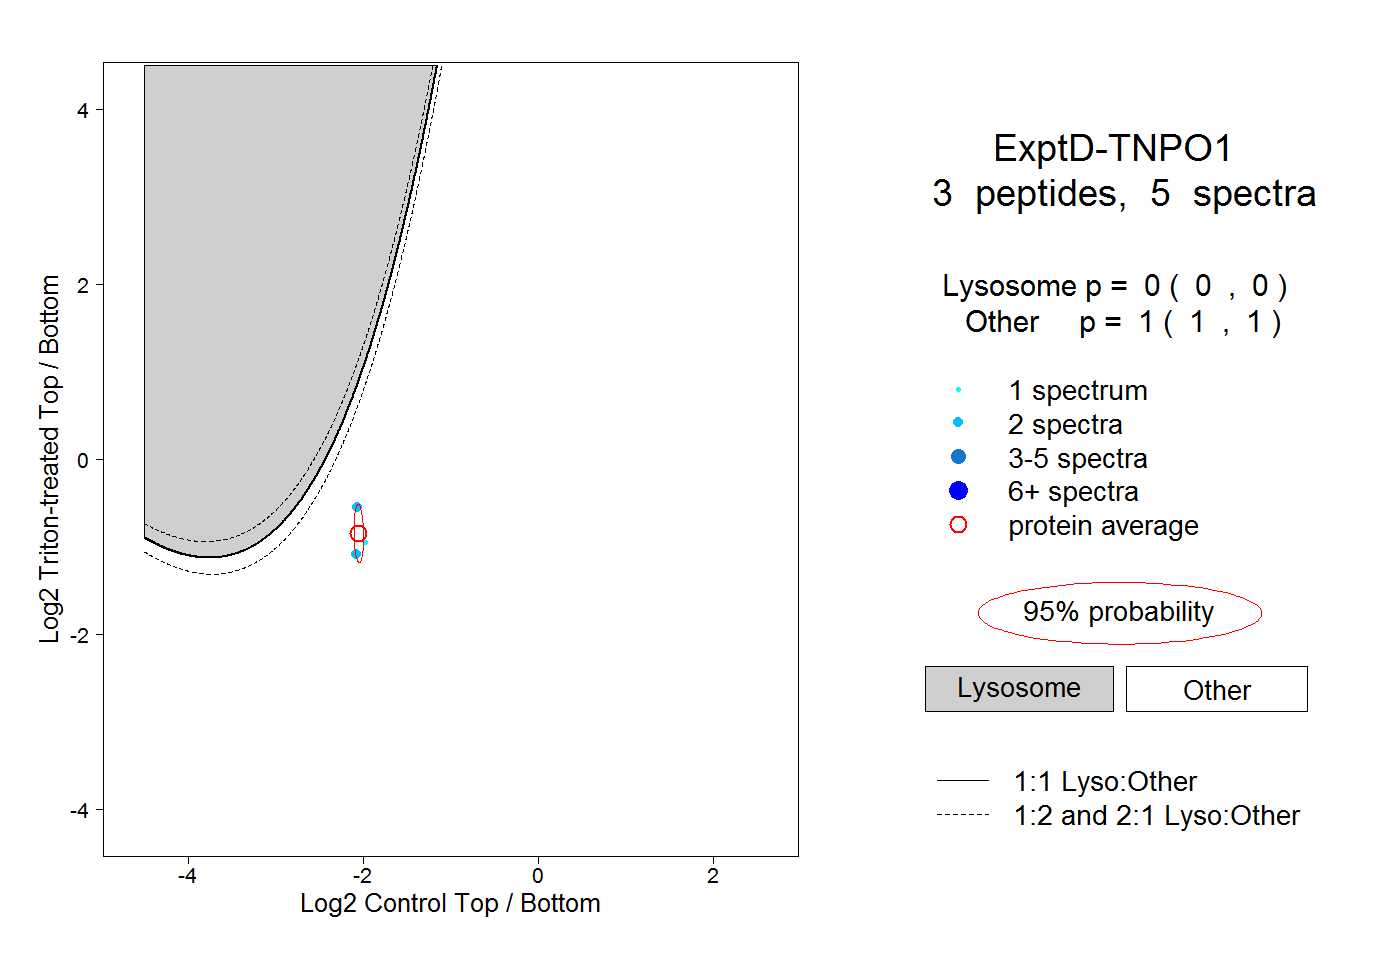
5peptides
spectra
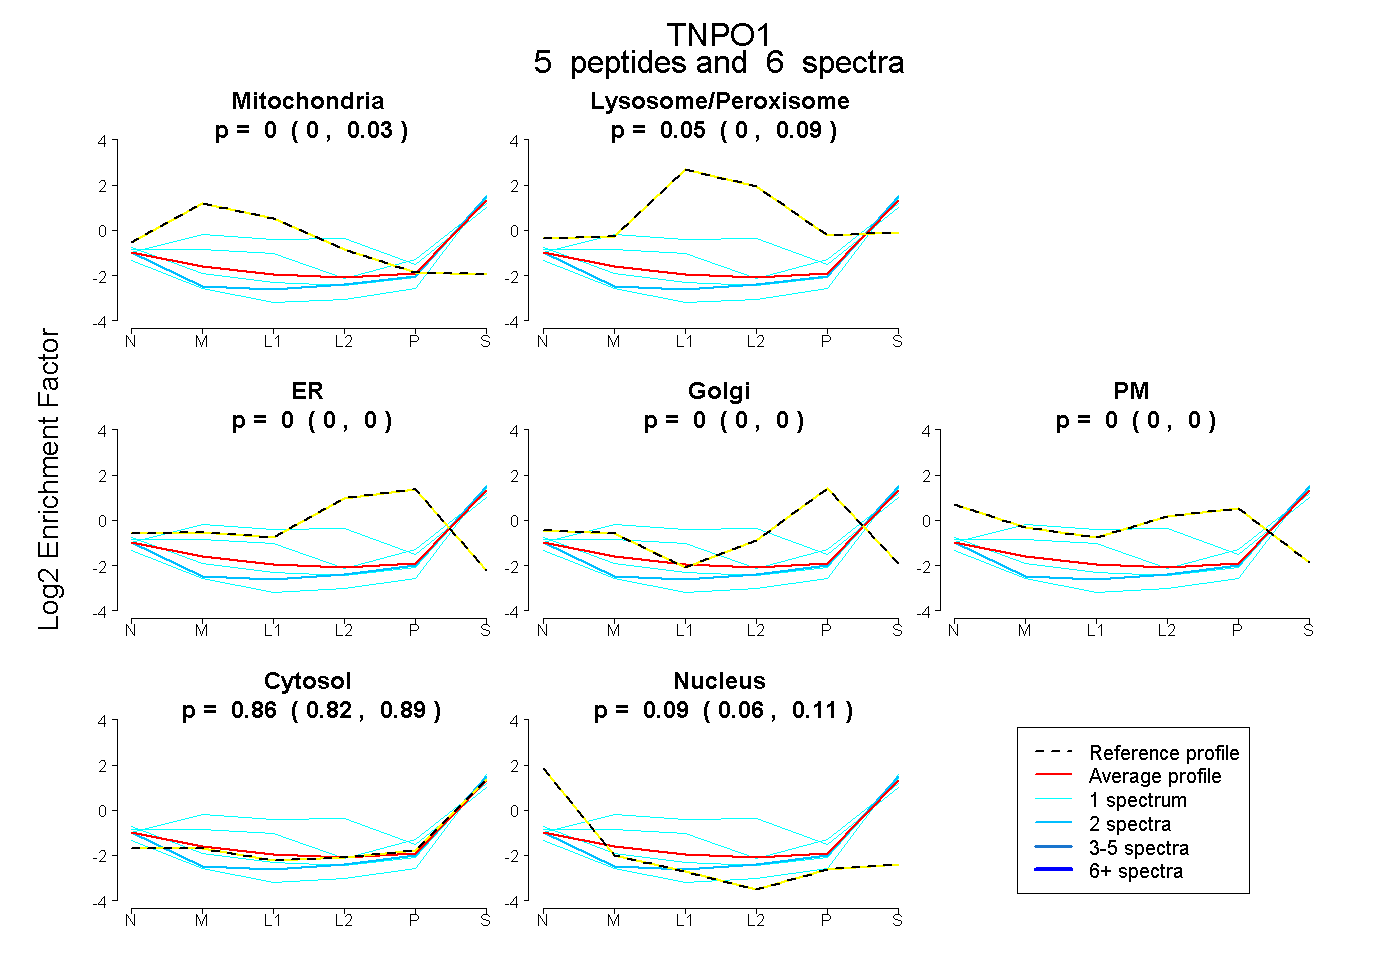
0.000 | 0.031
0.000 | 0.091
0.000 | 0.000
0.000 | 0.000
0.000 | 0.000
0.822 | 0.891
0.060 | 0.111