 15
15peptides
spectra
0.000 | 0.000
0.000 | 0.000
0.000 | 0.000
0.000 | 0.000
0.000 | 0.000
0.000 | 0.000
0.871 | 0.883
0.115 | 0.128
| Plot | Mito | Lyso | Perox | ER | Golgi | PM | Cytosol | Nucleus | |||||
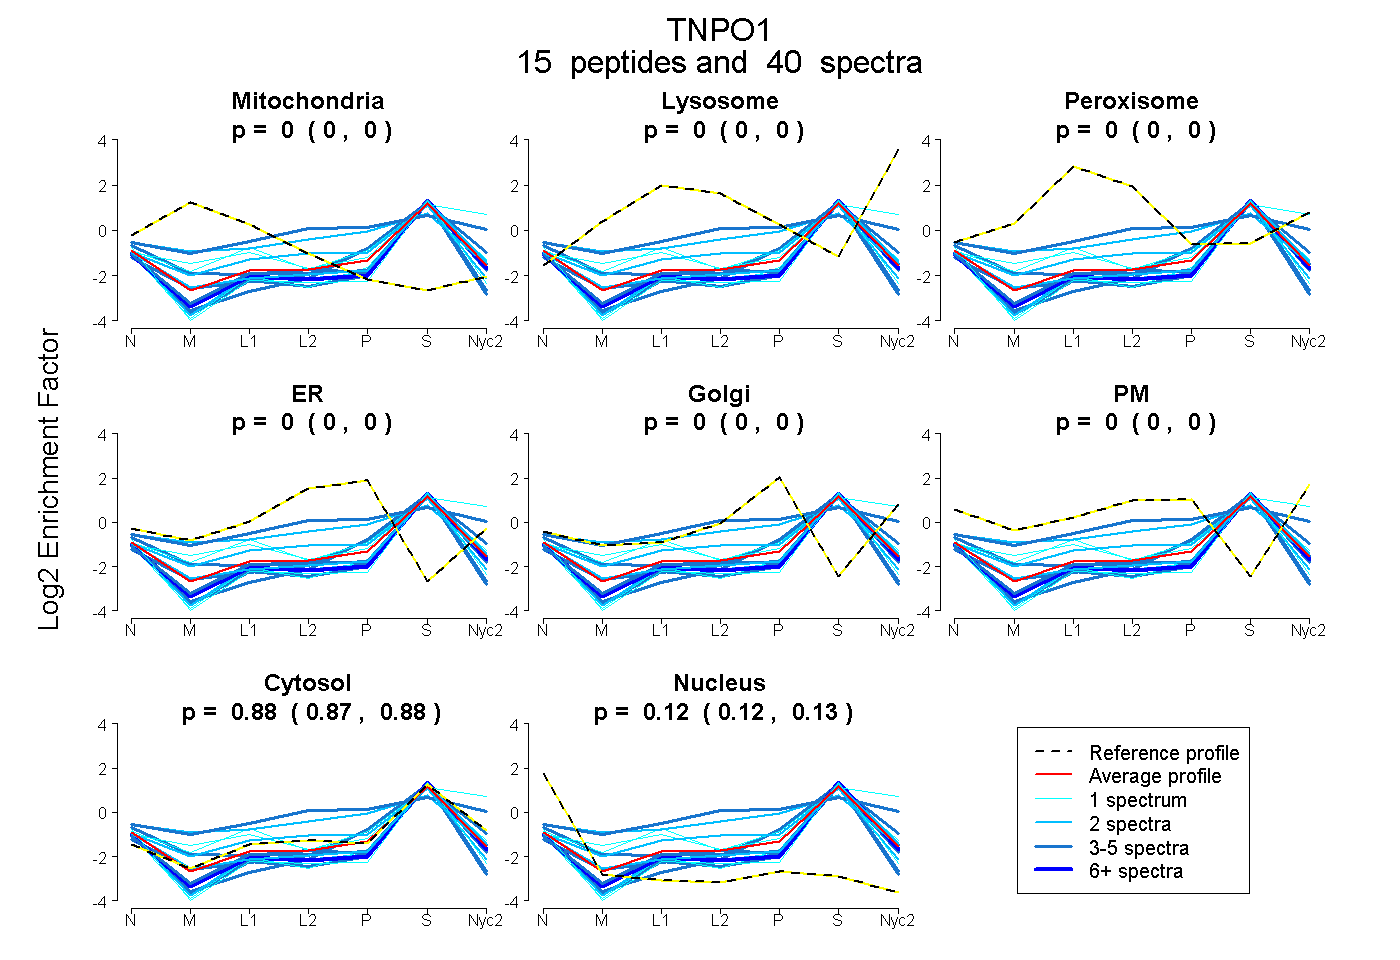
| Expt A |
15 peptides |
40 spectra |
|
0.000 0.000 | 0.000 |
0.000 0.000 | 0.000 |
0.000 0.000 | 0.000 |
0.000 0.000 | 0.000 |
0.000 0.000 | 0.000 |
0.000 0.000 | 0.000 |
0.878 0.871 | 0.883 |
0.122 0.115 | 0.128 |
| 2 spectra, TLLENTAITIGR | 0.000 | 0.000 | 0.000 | 0.000 | 0.000 | 0.000 | 0.865 | 0.135 | ||
| 1 spectrum, GELQNWPDLLPK | 0.127 | 0.000 | 0.012 | 0.000 | 0.011 | 0.000 | 0.850 | 0.000 | ||
| 3 spectra, ATVGILITTIASK | 0.000 | 0.000 | 0.000 | 0.000 | 0.000 | 0.000 | 0.875 | 0.125 | ||
| 1 spectrum, YSDIDIILLK | 0.000 | 0.000 | 0.000 | 0.000 | 0.000 | 0.000 | 0.753 | 0.247 | ||
| 5 spectra, SHAVACVNQFIISR | 0.000 | 0.000 | 0.230 | 0.000 | 0.183 | 0.078 | 0.509 | 0.000 | ||
| 4 spectra, ELLFHHEWVVK | 0.000 | 0.000 | 0.000 | 0.000 | 0.000 | 0.000 | 0.760 | 0.240 | ||
| 2 spectra, ESQSPDTTIQR | 0.000 | 0.000 | 0.000 | 0.000 | 0.000 | 0.000 | 0.846 | 0.154 | ||
| 1 spectrum, GDVEEDEAIPDSEQDIRPR | 0.000 | 0.000 | 0.000 | 0.000 | 0.000 | 0.000 | 0.828 | 0.172 | ||
| 4 spectra, ALVMLLEVR | 0.000 | 0.000 | 0.000 | 0.000 | 0.000 | 0.000 | 0.822 | 0.178 | ||
| 3 spectra, SITCWTLSR | 0.000 | 0.000 | 0.000 | 0.000 | 0.000 | 0.000 | 0.800 | 0.200 | ||
| 3 spectra, FLQFFK | 0.026 | 0.000 | 0.000 | 0.000 | 0.000 | 0.000 | 0.865 | 0.109 | ||
| 1 spectrum, LIPVLVNGMK | 0.000 | 0.191 | 0.000 | 0.000 | 0.000 | 0.000 | 0.802 | 0.007 | ||
| 2 spectra, NQVGDENWR | 0.109 | 0.000 | 0.045 | 0.225 | 0.000 | 0.000 | 0.622 | 0.000 | ||
| 6 spectra, ILHGFK | 0.000 | 0.000 | 0.000 | 0.000 | 0.000 | 0.000 | 0.840 | 0.160 | ||
| 2 spectra, SNILTLMYQCMQDK | 0.075 | 0.000 | 0.000 | 0.038 | 0.000 | 0.000 | 0.826 | 0.062 |
| Plot | Mito | Lyso or Perox | ER | Golgi | PM | Cytosol | Nucleus | ||||||
| Expt B |
5 peptides |
6 spectra |
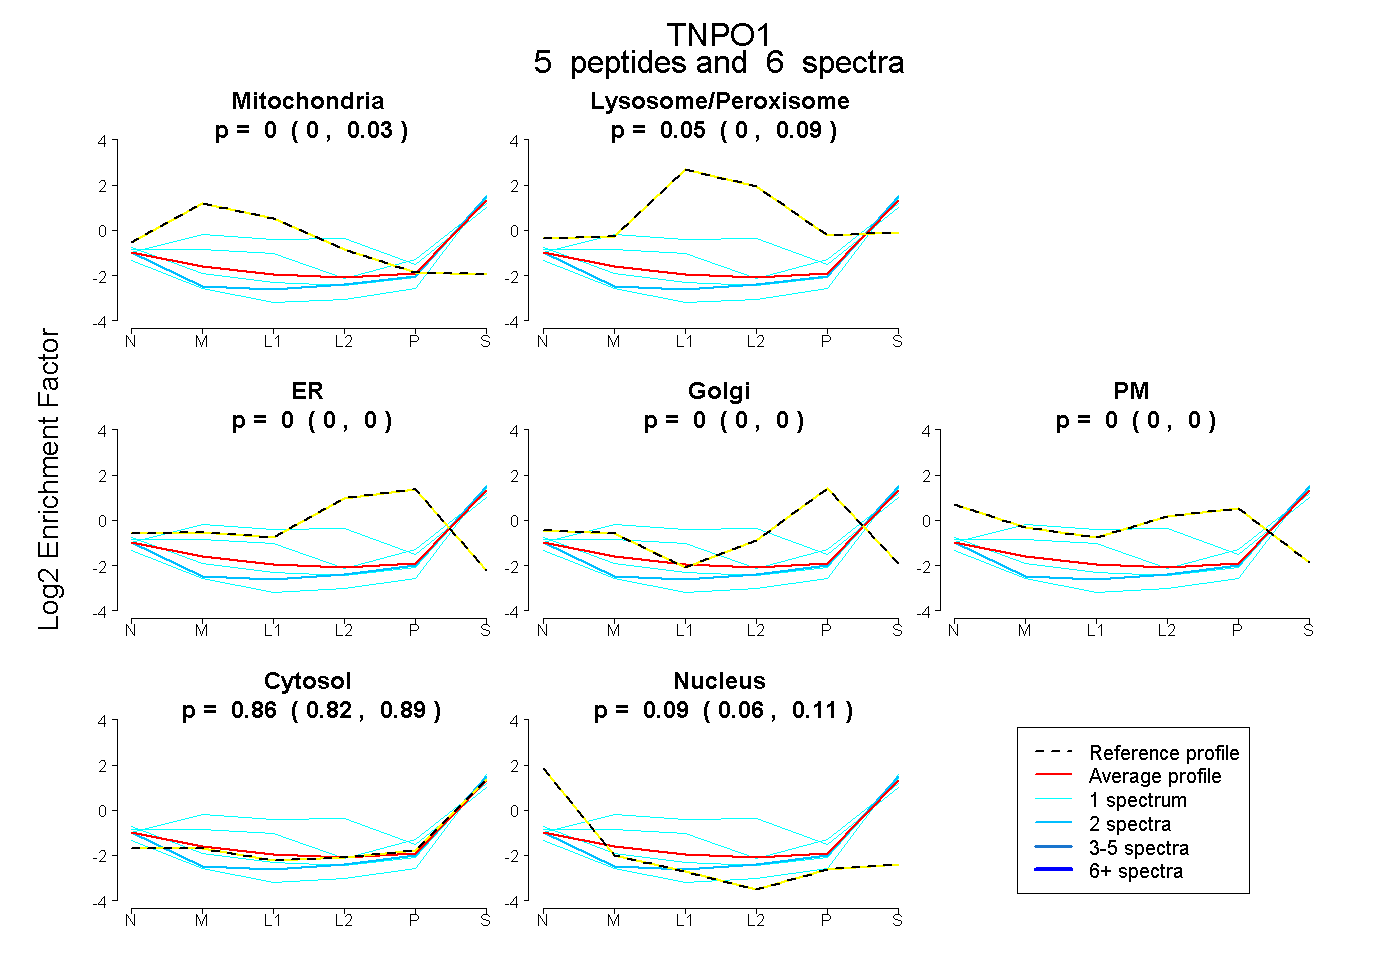 |
0.000 0.000 | 0.031 |
0.047 0.000 | 0.091 |
0.000 0.000 | 0.000 |
0.000 0.000 | 0.000 |
0.000 0.000 | 0.000 |
0.861 0.822 | 0.891 |
0.091 0.060 | 0.111 |
|||
| Plot | Lyso | Other | |||||||||||
| Expt C |
8 peptides |
20 spectra |
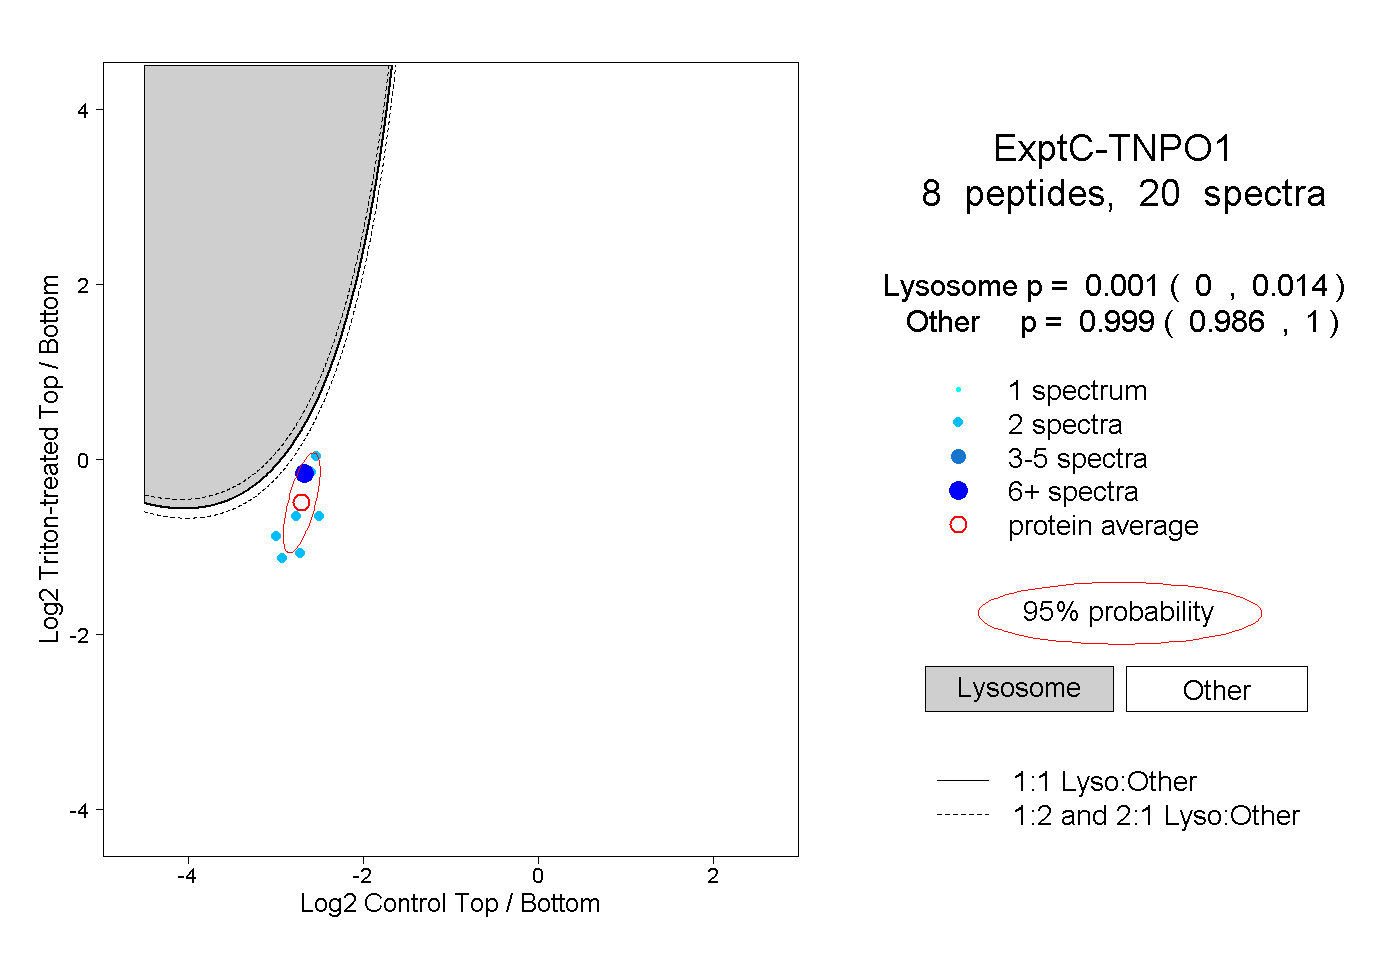 |
0.001 0.000 | 0.014 |
0.999 0.986 | 1.000 |
||||||||
| Plot | Lyso | Other | |||||||||||
| Expt D |
3 peptides |
5 spectra |
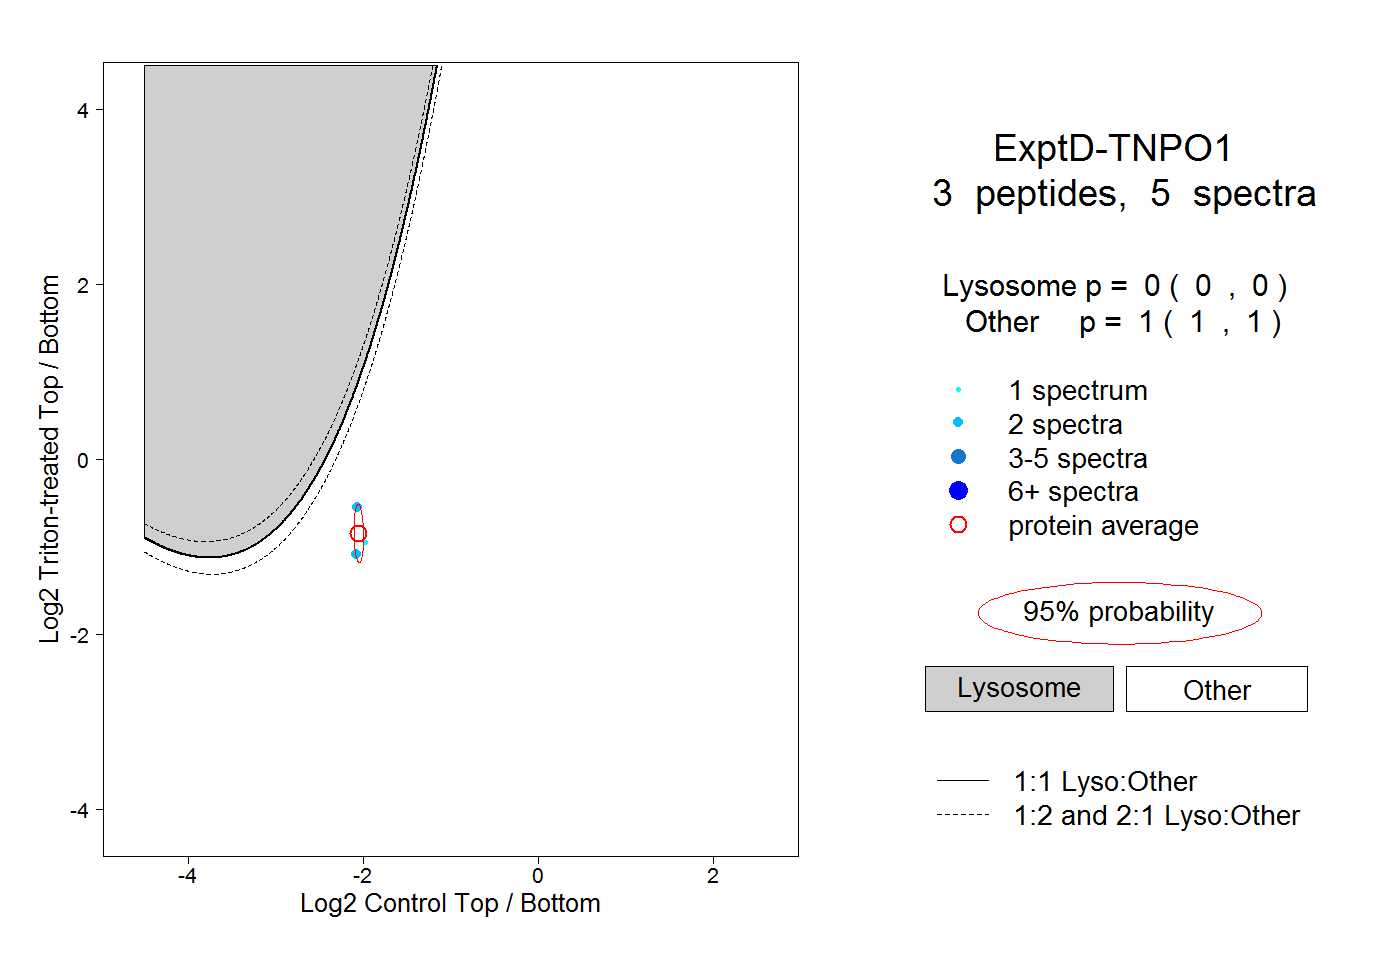 |
0.000 0.000 | 0.000 |
1.000 1.000 | 1.000 |