14
14peptides
spectra
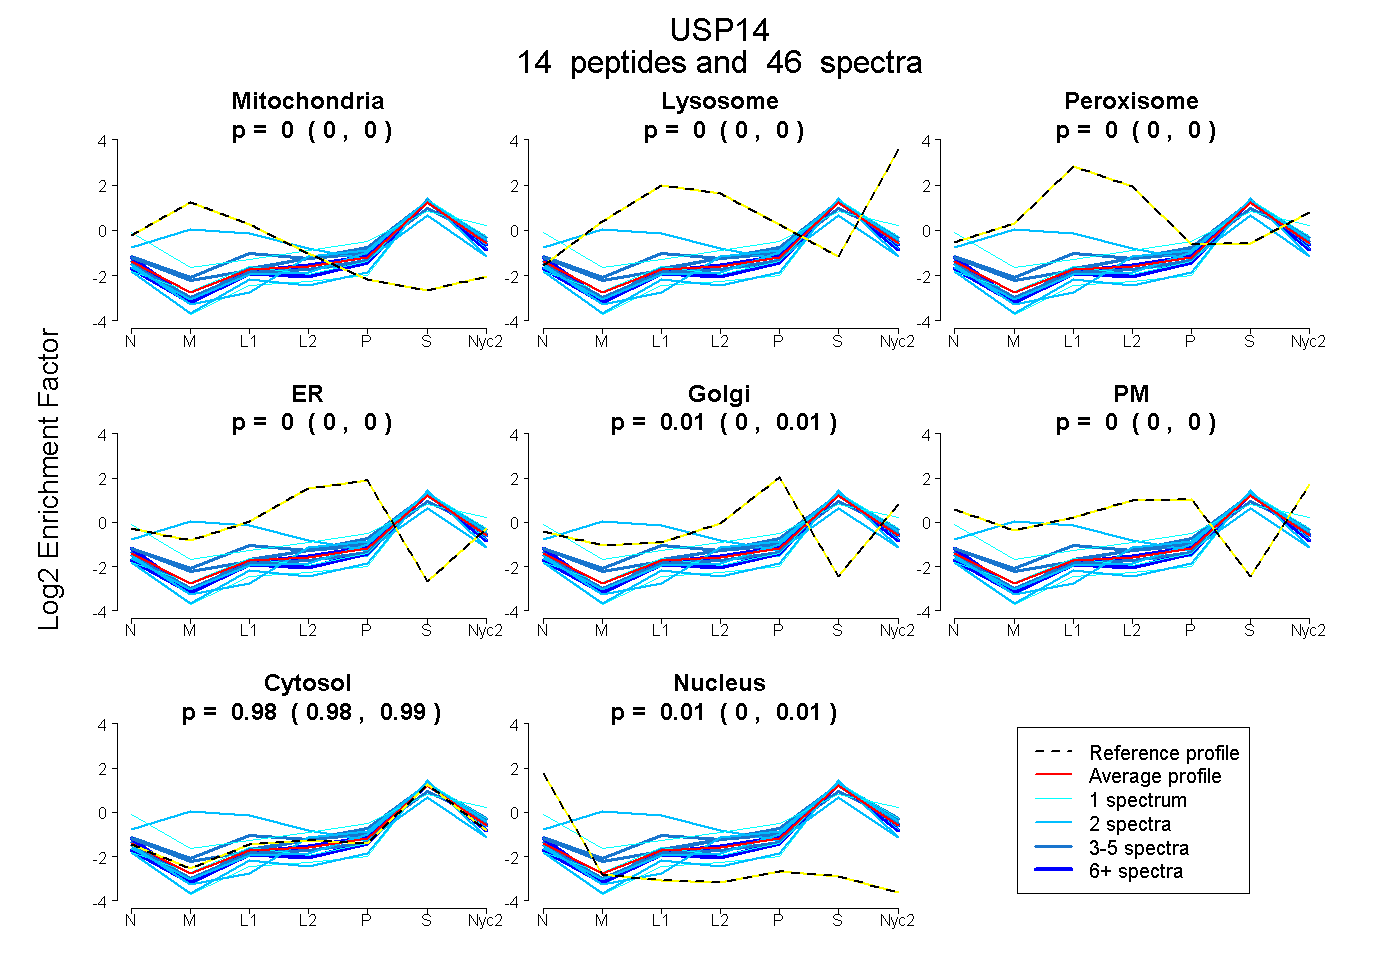
0.000 | 0.000
0.000 | 0.000
0.000 | 0.000
0.000 | 0.000
0.002 | 0.011
0.000 | 0.000
0.979 | 0.988
0.005 | 0.012
4peptides
spectra
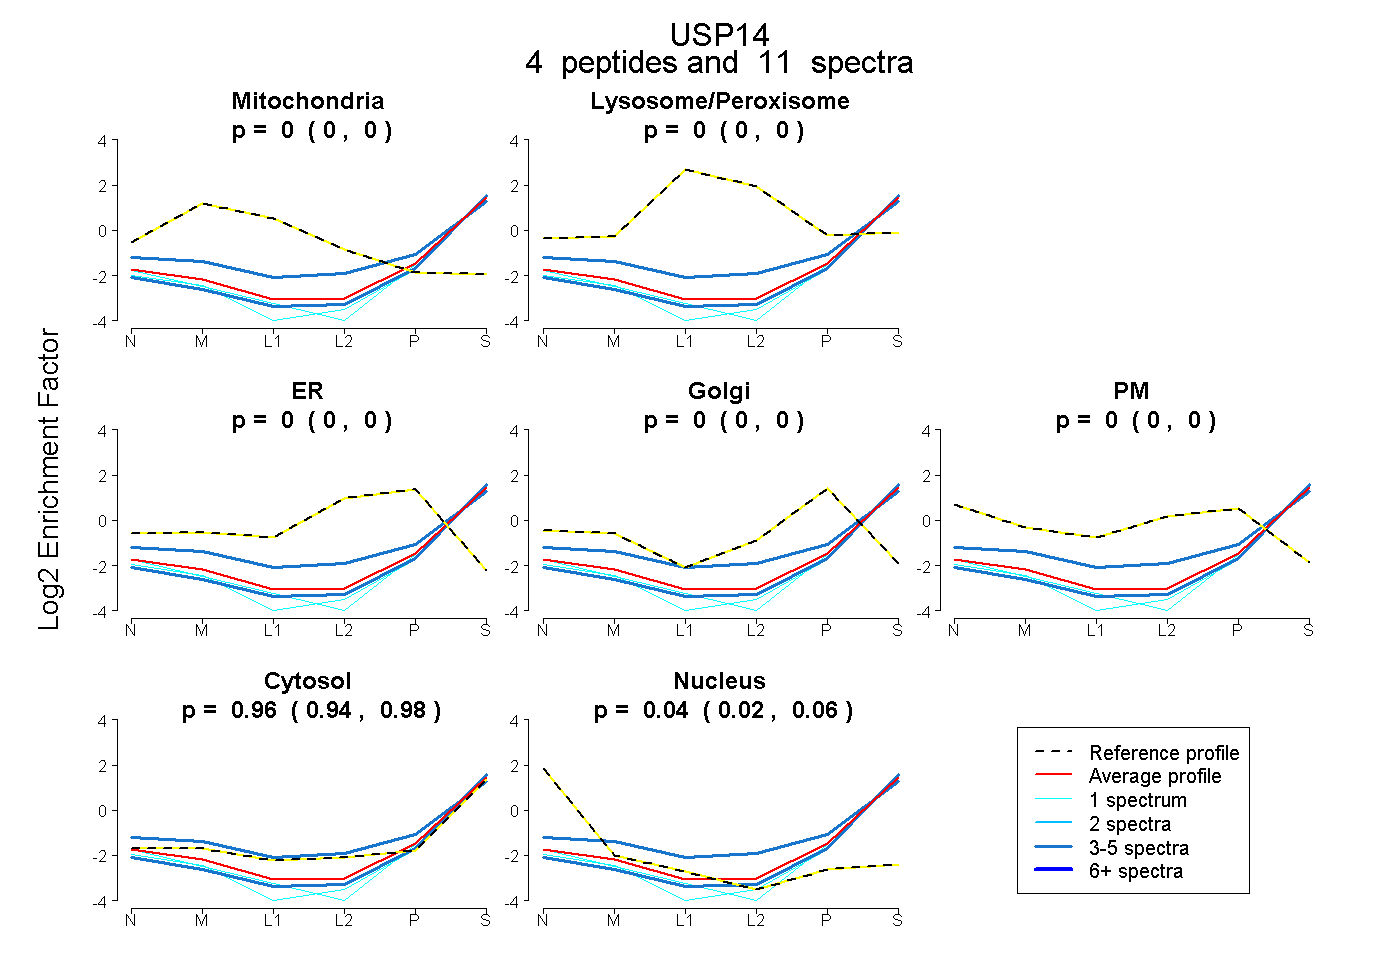
0.000 | 0.000
0.000 | 0.000
0.000 | 0.000
0.000 | 0.000
0.000 | 0.000
0.940 | 0.981
0.016 | 0.058
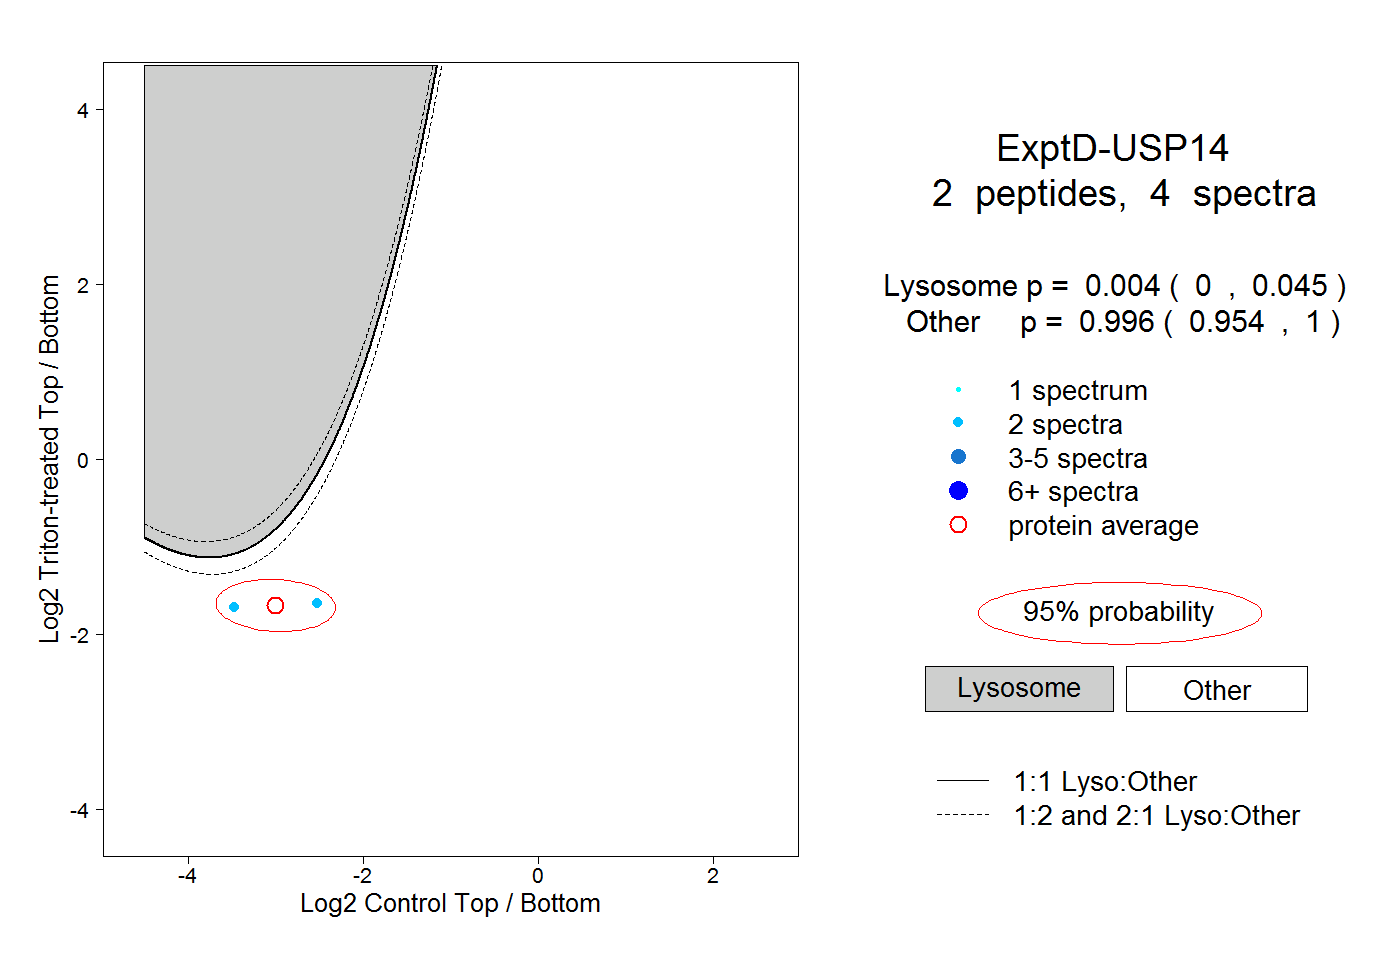
14peptides
spectra
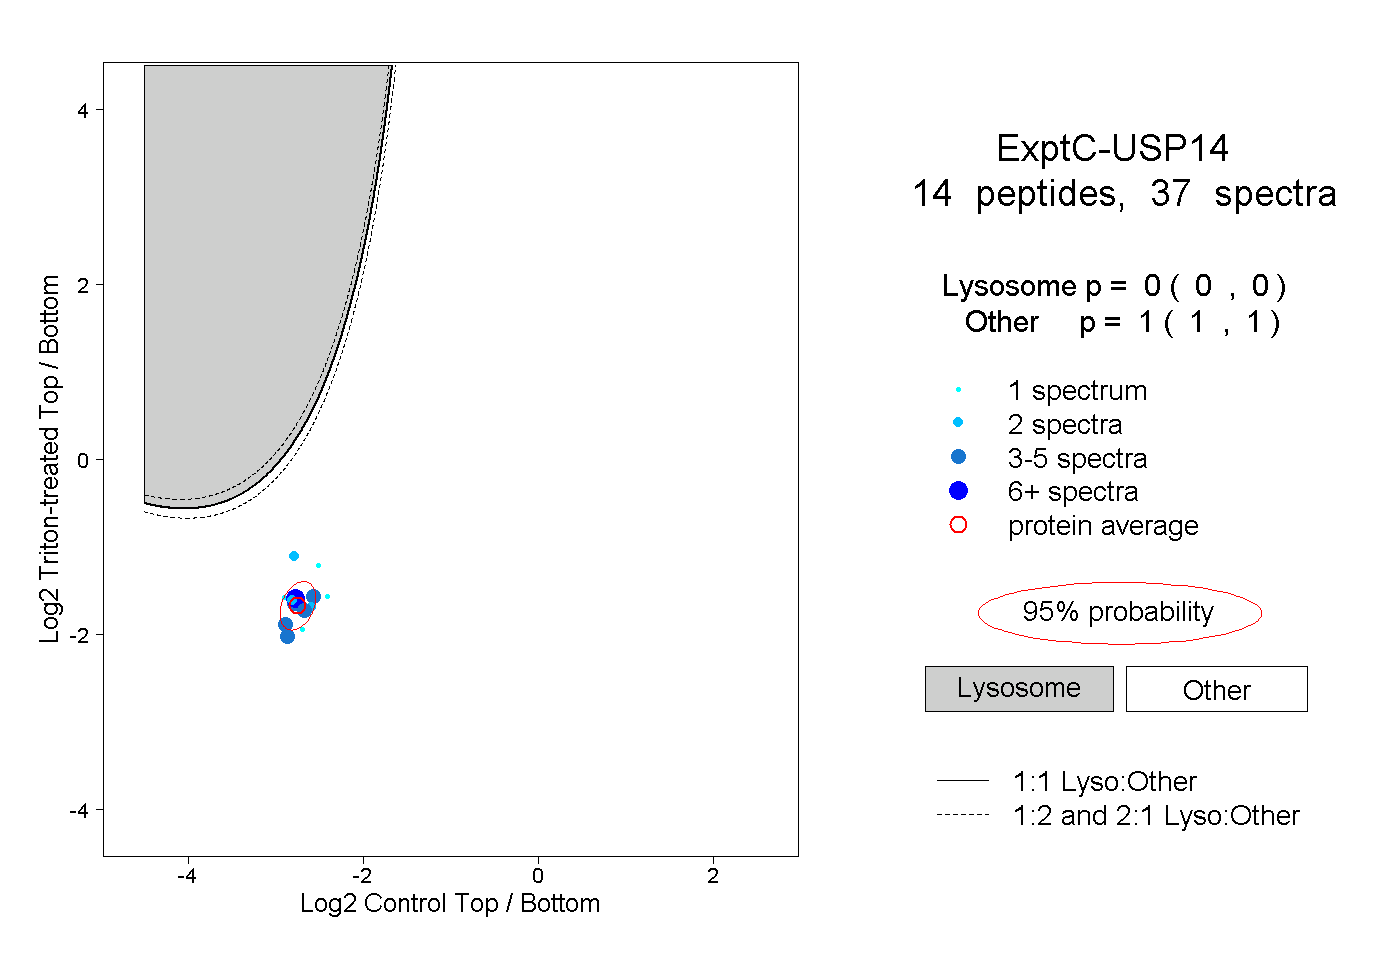
0.000 | 0.000
1.000 | 1.000