 14
14peptides
spectra
0.000 | 0.000
0.000 | 0.000
0.000 | 0.000
0.000 | 0.000
0.002 | 0.011
0.000 | 0.000
0.979 | 0.988
0.005 | 0.012
| Plot | Mito | Lyso | Perox | ER | Golgi | PM | Cytosol | Nucleus | |||||
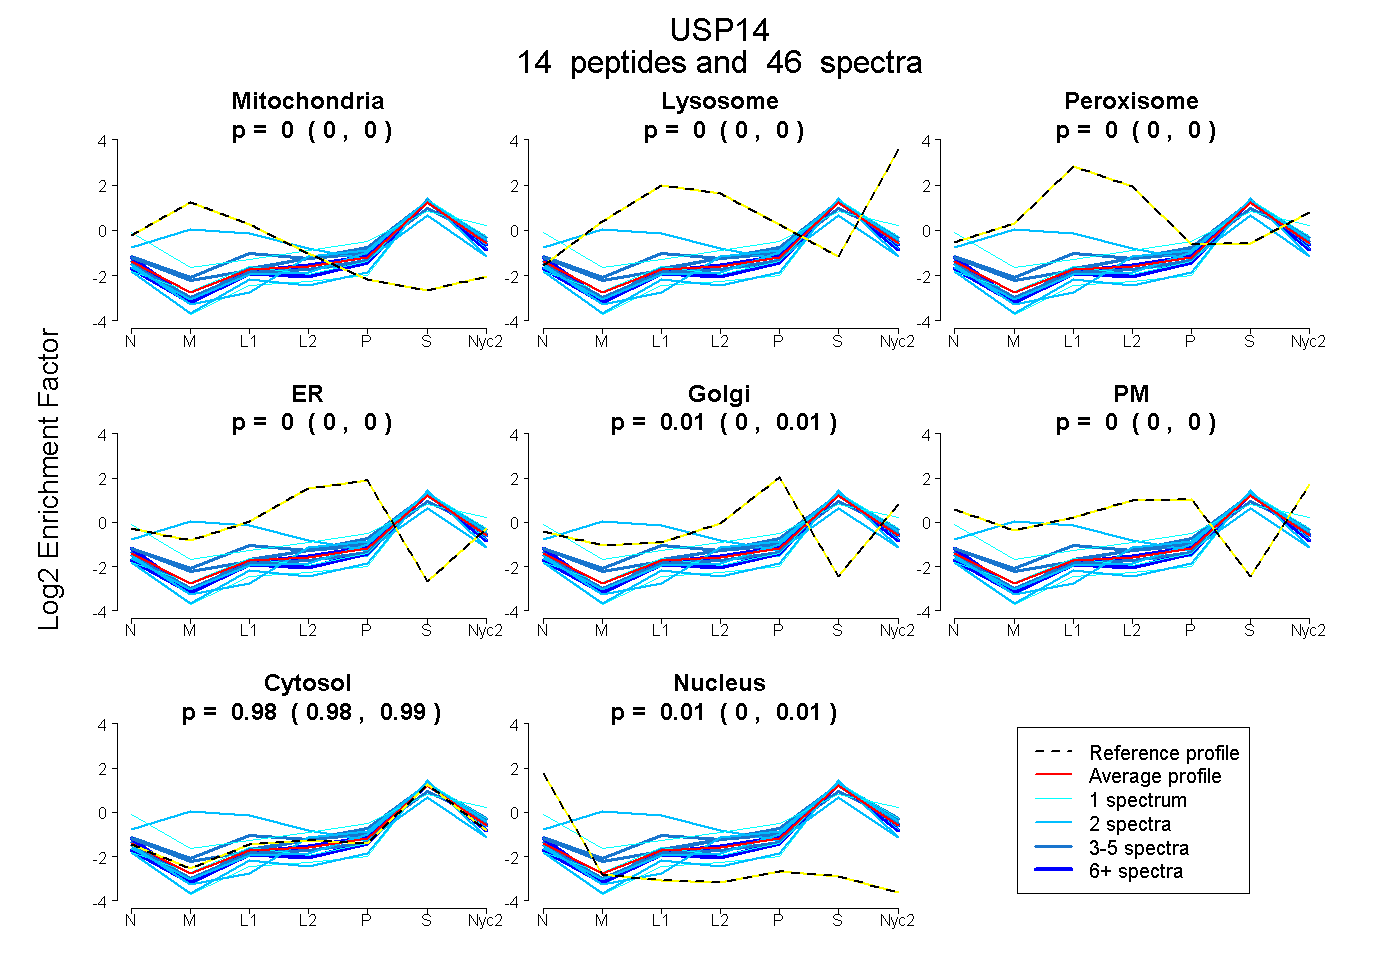
| Expt A |
14 peptides |
46 spectra |
|
0.000 0.000 | 0.000 |
0.000 0.000 | 0.000 |
0.000 0.000 | 0.000 |
0.000 0.000 | 0.000 |
0.008 0.002 | 0.011 |
0.000 0.000 | 0.000 |
0.984 0.979 | 0.988 |
0.008 0.005 | 0.012 |
| 1 spectrum, YLFTGLK | 0.000 | 0.000 | 0.000 | 0.000 | 0.000 | 0.284 | 0.716 | 0.000 | ||
| 2 spectra, VSIVTPEDILR | 0.000 | 0.000 | 0.000 | 0.000 | 0.000 | 0.000 | 0.999 | 0.001 | ||
| 4 spectra, ASGEMASAQYITAALR | 0.011 | 0.064 | 0.000 | 0.000 | 0.015 | 0.050 | 0.860 | 0.000 | ||
| 3 spectra, DDDWGNIK | 0.000 | 0.000 | 0.000 | 0.000 | 0.065 | 0.000 | 0.935 | 0.000 | ||
| 4 spectra, QSPTLQR | 0.000 | 0.000 | 0.000 | 0.000 | 0.000 | 0.000 | 0.997 | 0.003 | ||
| 3 spectra, PLYSVTVK | 0.000 | 0.000 | 0.000 | 0.000 | 0.085 | 0.000 | 0.915 | 0.000 | ||
| 1 spectrum, ETESSSASAVTPSK | 0.000 | 0.000 | 0.000 | 0.000 | 0.000 | 0.000 | 0.944 | 0.056 | ||
| 9 spectra, DLFDSMDK | 0.000 | 0.000 | 0.000 | 0.000 | 0.000 | 0.000 | 0.970 | 0.030 | ||
| 2 spectra, NALYIK | 0.302 | 0.000 | 0.187 | 0.000 | 0.000 | 0.000 | 0.510 | 0.000 | ||
| 2 spectra, LPAYLTIQMVR | 0.000 | 0.000 | 0.000 | 0.000 | 0.000 | 0.000 | 0.926 | 0.074 | ||
| 2 spectra, SLIDQFFGVEFETTMK | 0.000 | 0.000 | 0.000 | 0.000 | 0.015 | 0.000 | 0.985 | 0.000 | ||
| 2 spectra, AQLFALTGVQPAR | 0.000 | 0.000 | 0.000 | 0.000 | 0.000 | 0.000 | 1.000 | 0.000 | ||
| 10 spectra, LEAIEDDSAR | 0.000 | 0.000 | 0.000 | 0.000 | 0.000 | 0.000 | 0.976 | 0.024 | ||
| 1 spectrum, VNQQPNANDK | 0.000 | 0.000 | 0.000 | 0.000 | 0.000 | 0.000 | 1.000 | 0.000 |
| Plot | Mito | Lyso or Perox | ER | Golgi | PM | Cytosol | Nucleus | ||||||
| Expt B |
4 peptides |
11 spectra |
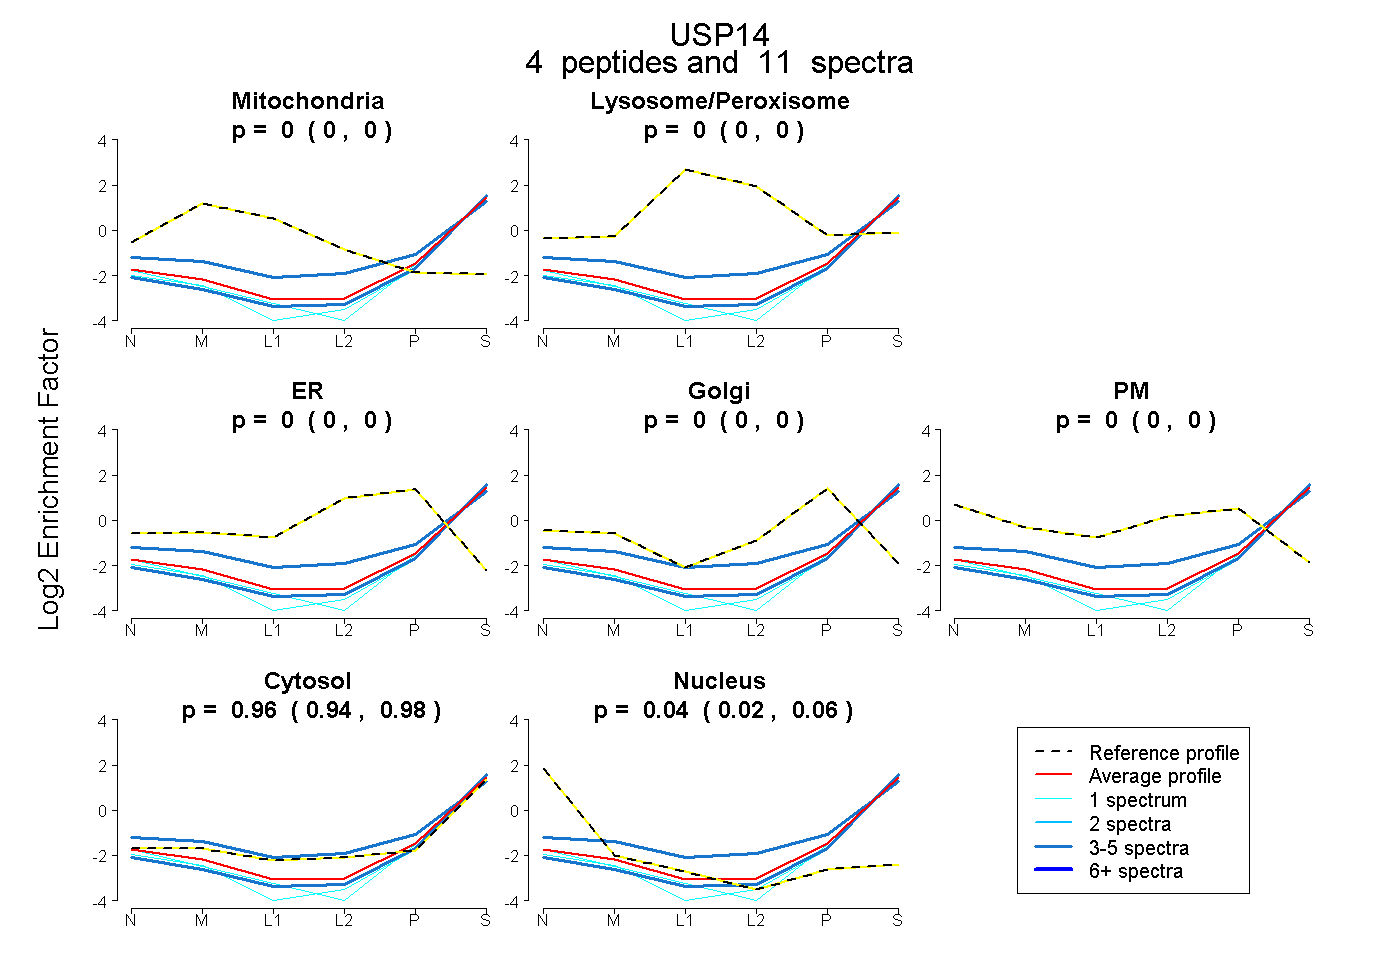 |
0.000 0.000 | 0.000 |
0.000 0.000 | 0.000 |
0.000 0.000 | 0.000 |
0.000 0.000 | 0.000 |
0.000 0.000 | 0.000 |
0.962 0.940 | 0.981 |
0.038 0.016 | 0.058 |
|||
| Plot | Lyso | Other | |||||||||||
| Expt C |
14 peptides |
37 spectra |
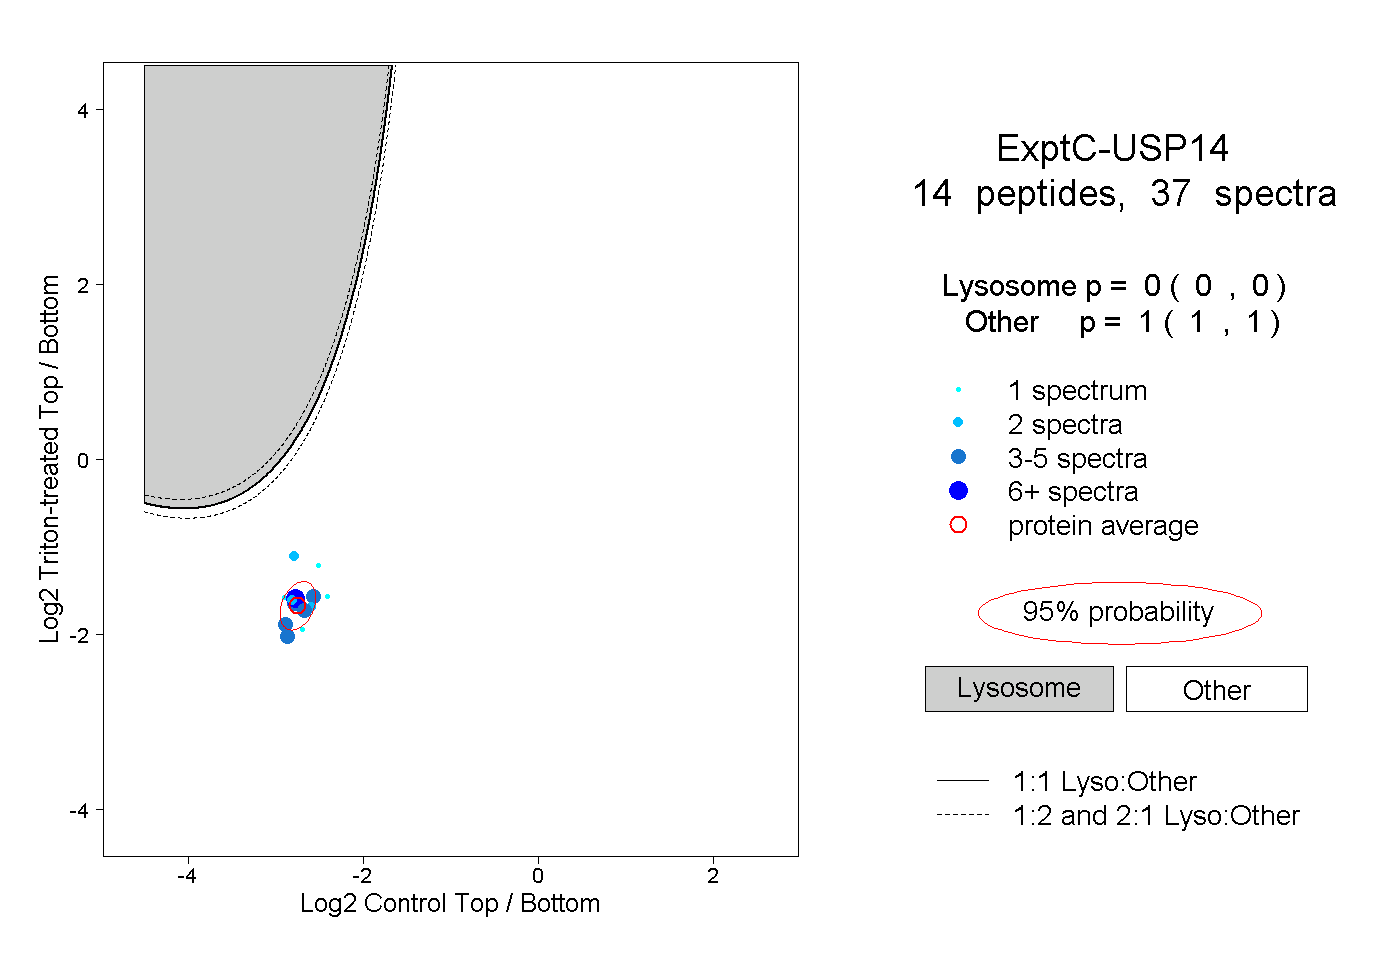 |
0.000 0.000 | 0.000 |
1.000 1.000 | 1.000 |
||||||||
| Plot | Lyso | Other | |||||||||||
| Expt D |
2 peptides |
4 spectra |
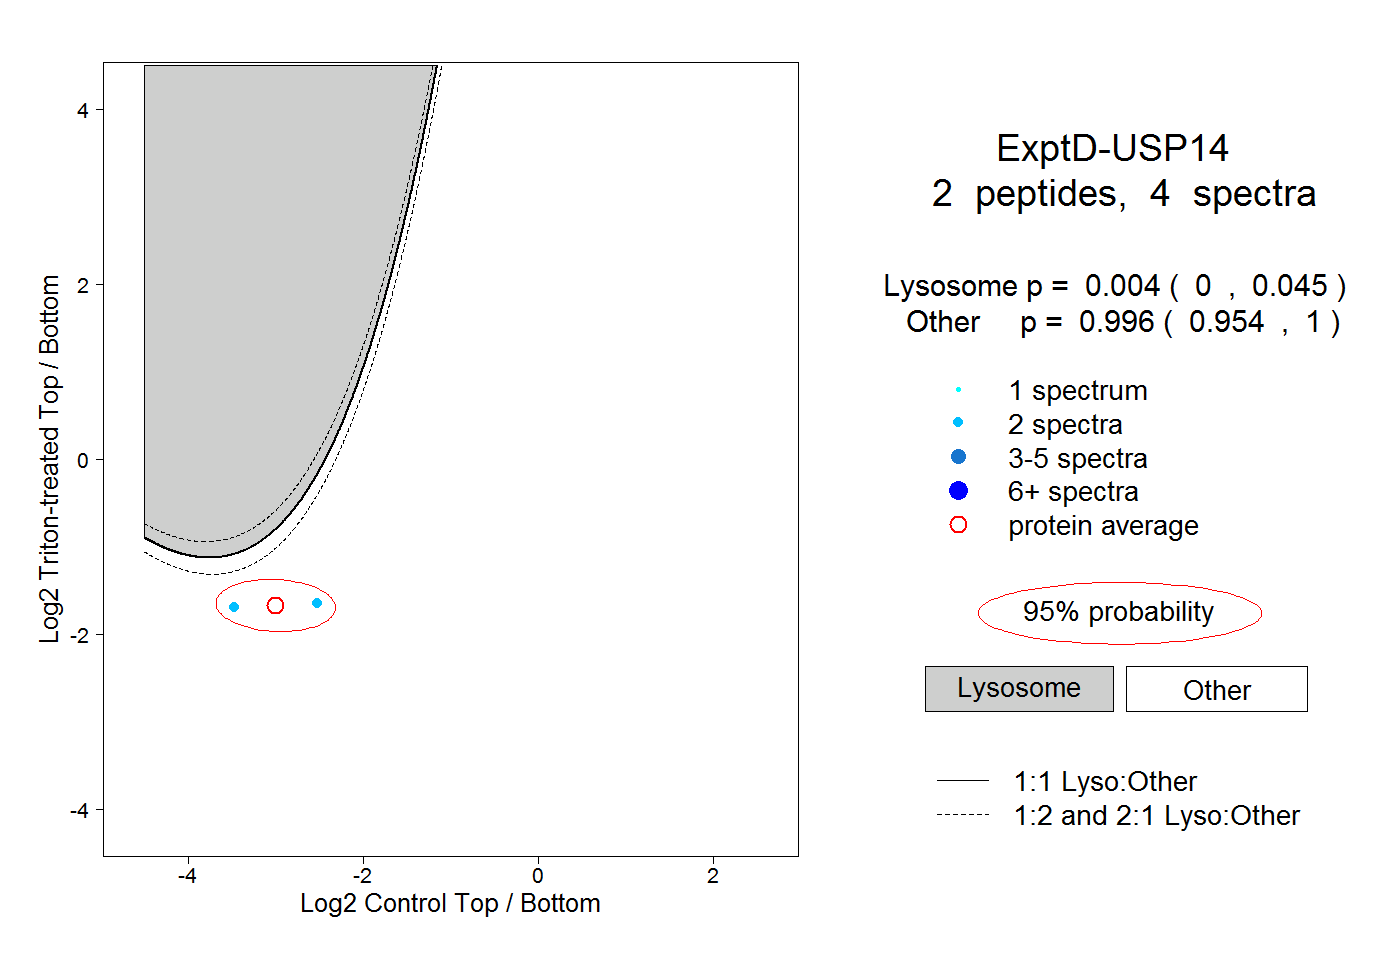 |
0.004 0.000 | 0.045 |
0.996 0.954 | 1.000 |