 5
5peptides
spectra
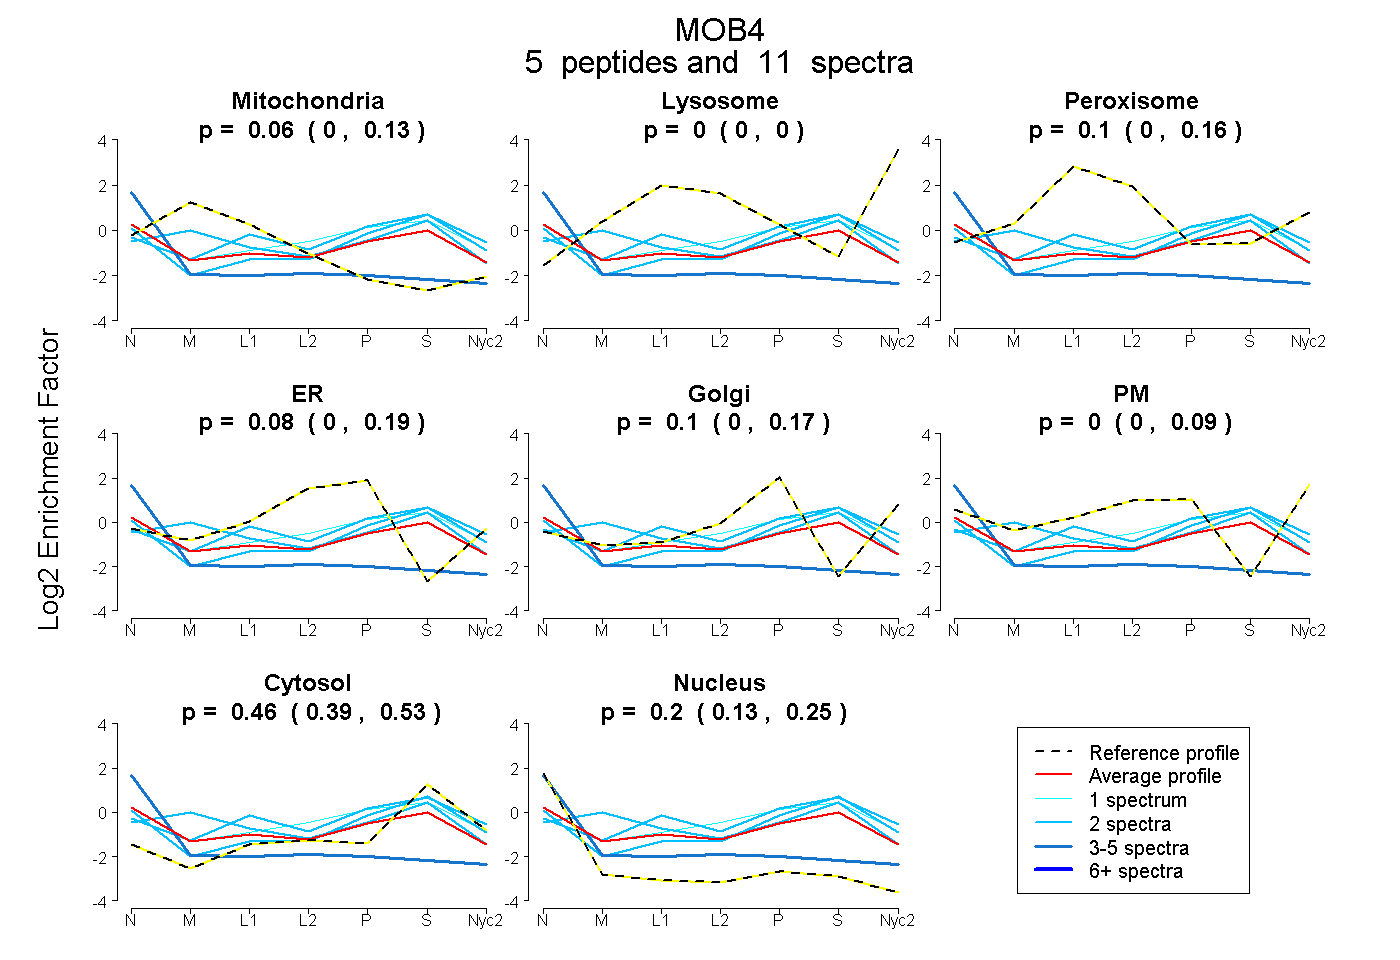
0.000 | 0.130
0.000 | 0.000
0.002 | 0.163
0.000 | 0.186
0.000 | 0.171
0.000 | 0.089
0.387 | 0.534
0.133 | 0.249
1peptide
spectrum
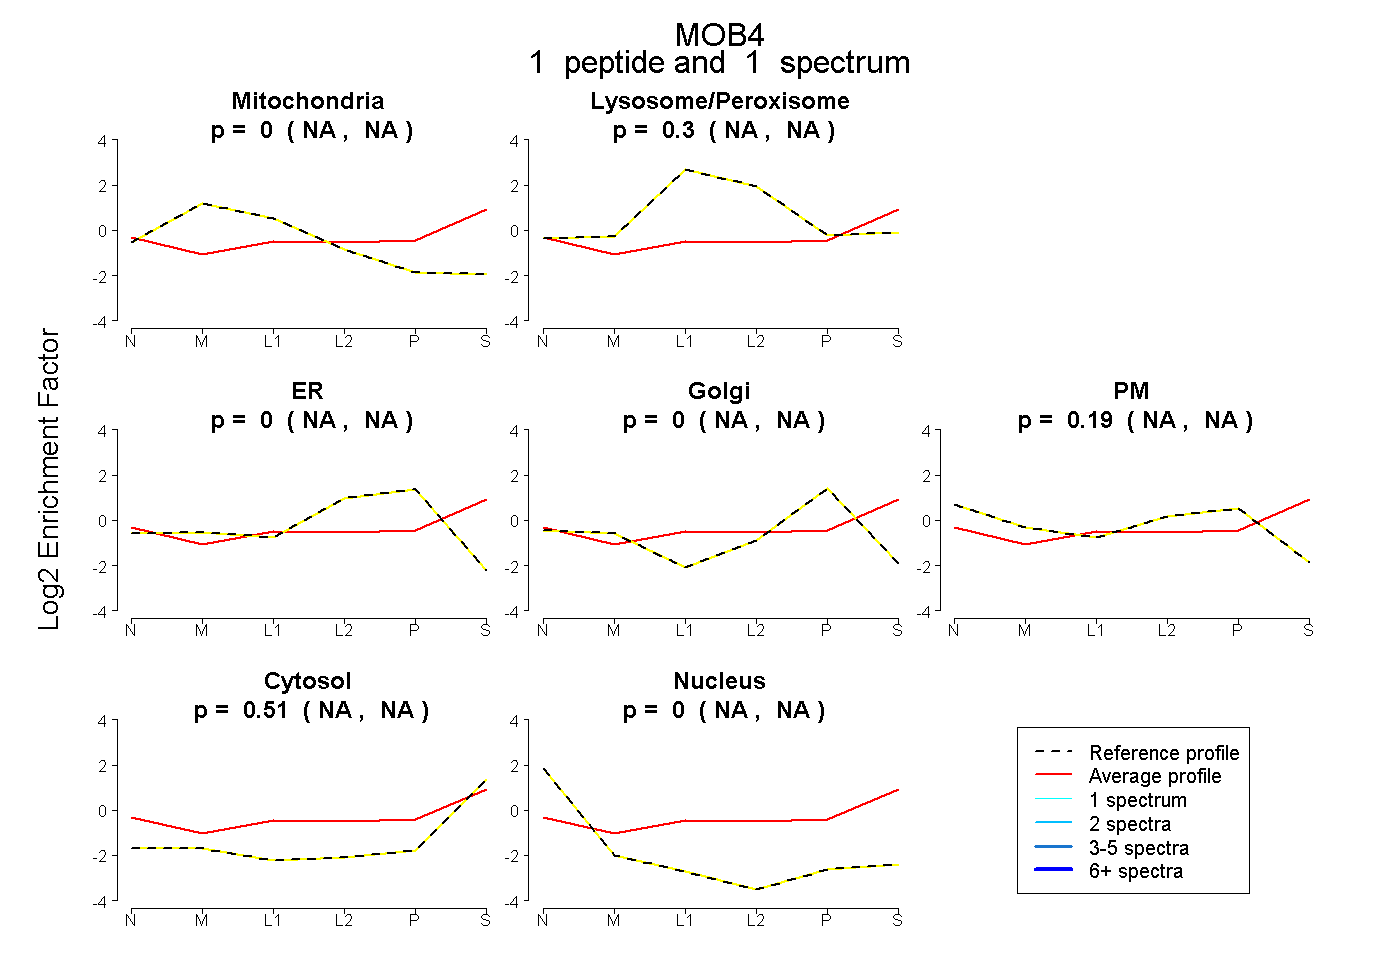
NA | NA
NA | NA
NA | NA
NA | NA
NA | NA
NA | NA
NA | NA
4peptides
spectra
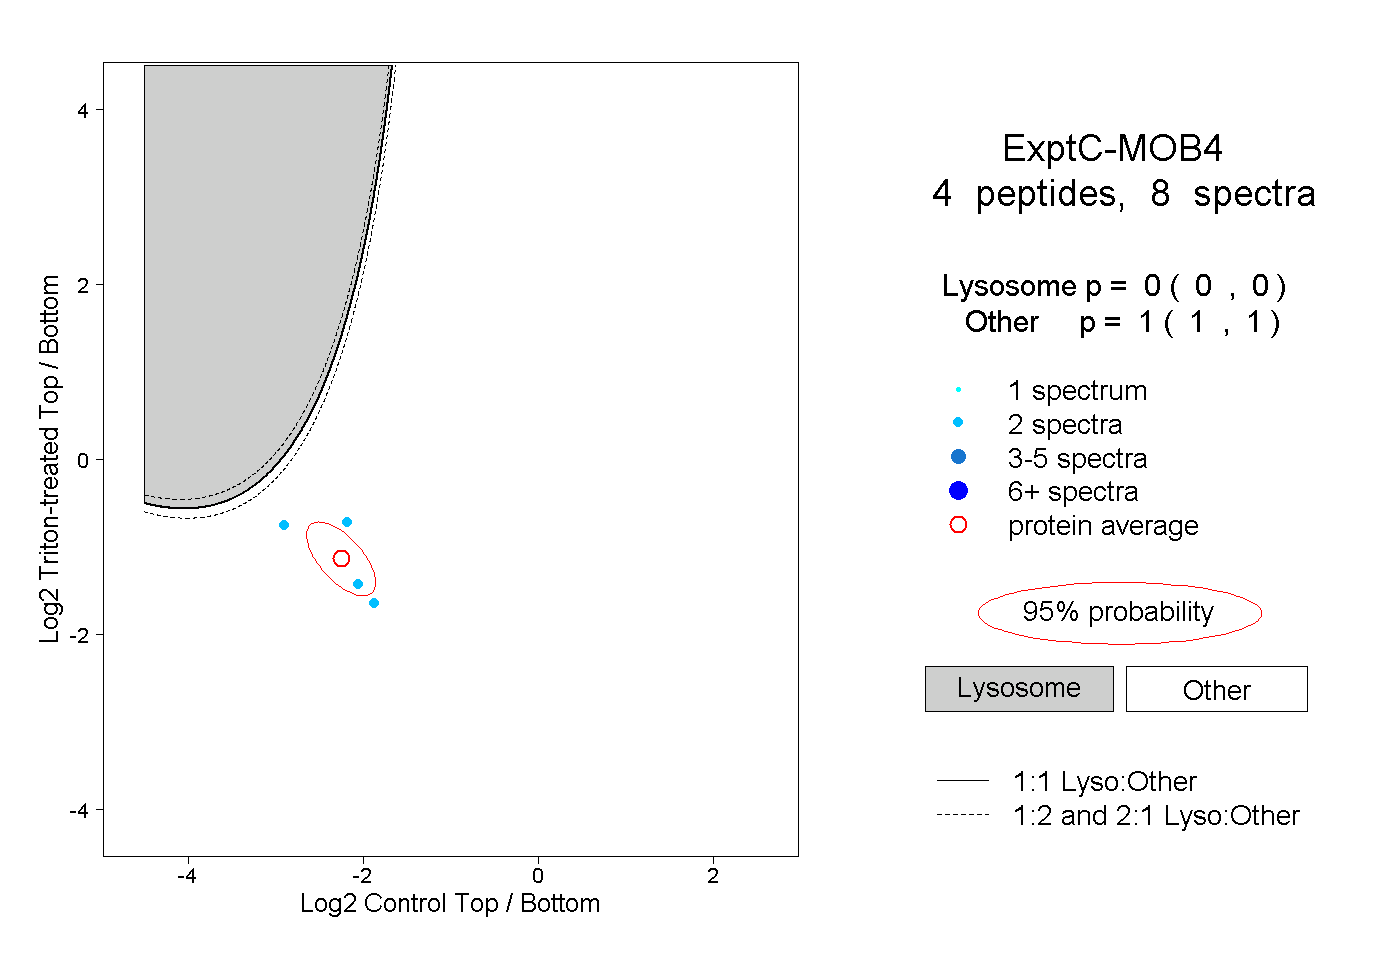
0.000 | 0.000
1.000 | 1.000
2peptides
spectra
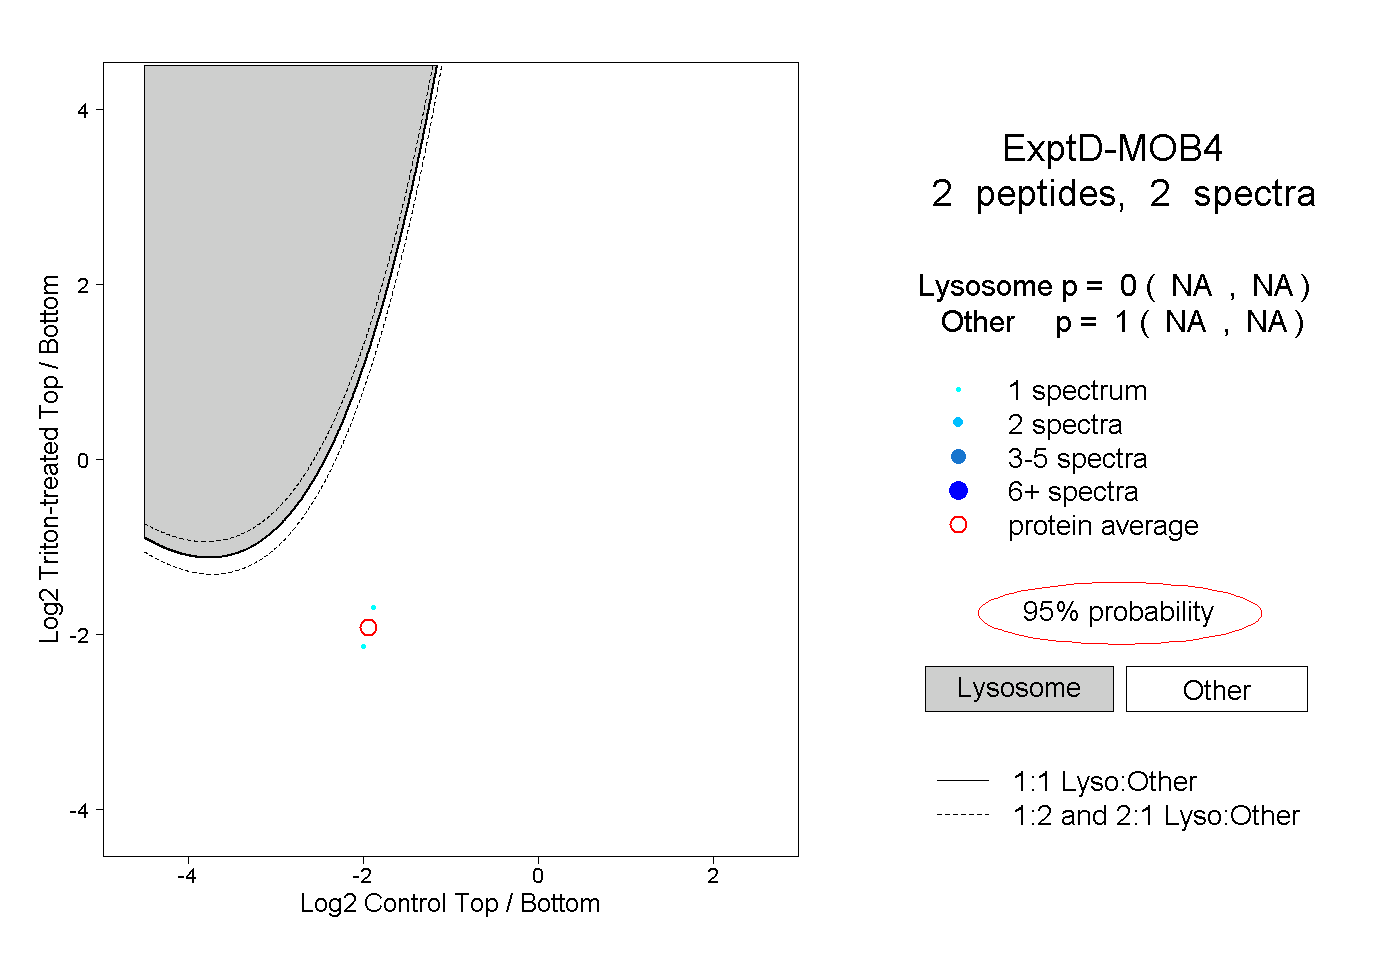
NA | NA
NA | NA