 2
2peptides
spectra
0.000 | 0.000
0.000 | 0.000
0.000 | 0.000
0.000 | 0.000
0.000 | 0.084
0.000 | 0.010
0.419 | 0.496
0.398 | 0.571
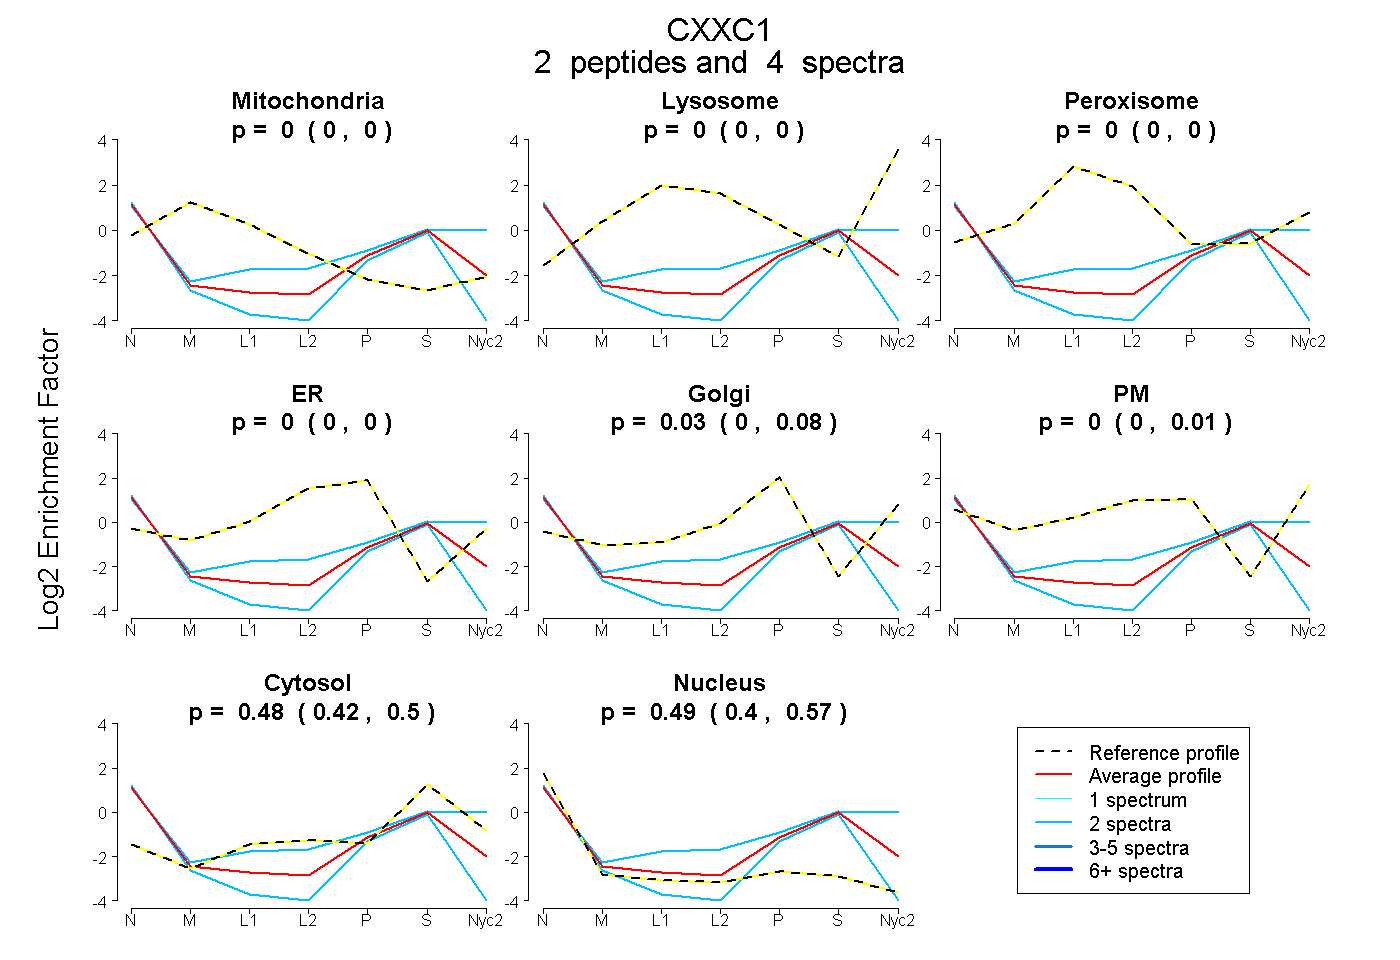
| Plot | Mito | Lyso | Perox | ER | Golgi | PM | Cytosol | Nucleus | |||||
| Expt A |
2 peptides |
4 spectra |
|
0.000 0.000 | 0.000 |
0.000 0.000 | 0.000 |
0.000 0.000 | 0.000 |
0.000 0.000 | 0.000 |
0.027 0.000 | 0.084 |
0.000 0.000 | 0.010 |
0.478 0.419 | 0.496 |
0.495 0.398 | 0.571 |
| 2 spectra, LDELFEQER | 0.000 | 0.000 | 0.000 | 0.000 | 0.000 | 0.000 | 0.264 | 0.736 | ||
| 2 spectra, FHELEAIILR | 0.000 | 0.000 | 0.000 | 0.000 | 0.000 | 0.259 | 0.505 | 0.236 |
| Plot | Mito | Lyso or Perox | ER | Golgi | PM | Cytosol | Nucleus | ||||||
| Expt B |
1 peptide |
1 spectrum |
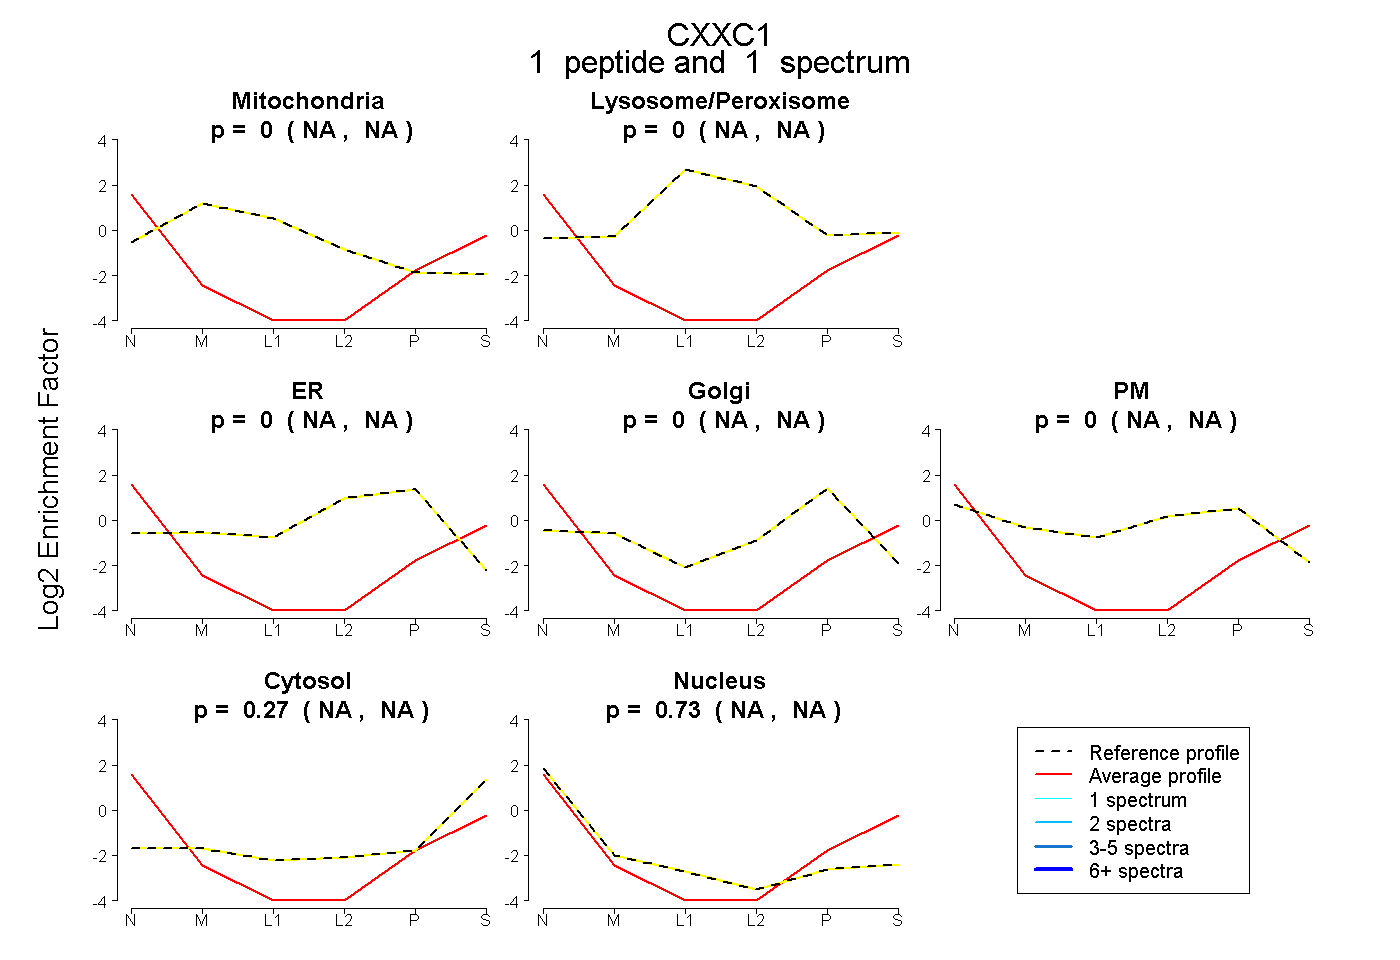 |
0.000 NA | NA |
0.000 NA | NA |
0.000 NA | NA |
0.000 NA | NA |
0.000 NA | NA |
0.274 NA | NA |
0.726 NA | NA |