 9
9peptides
spectra
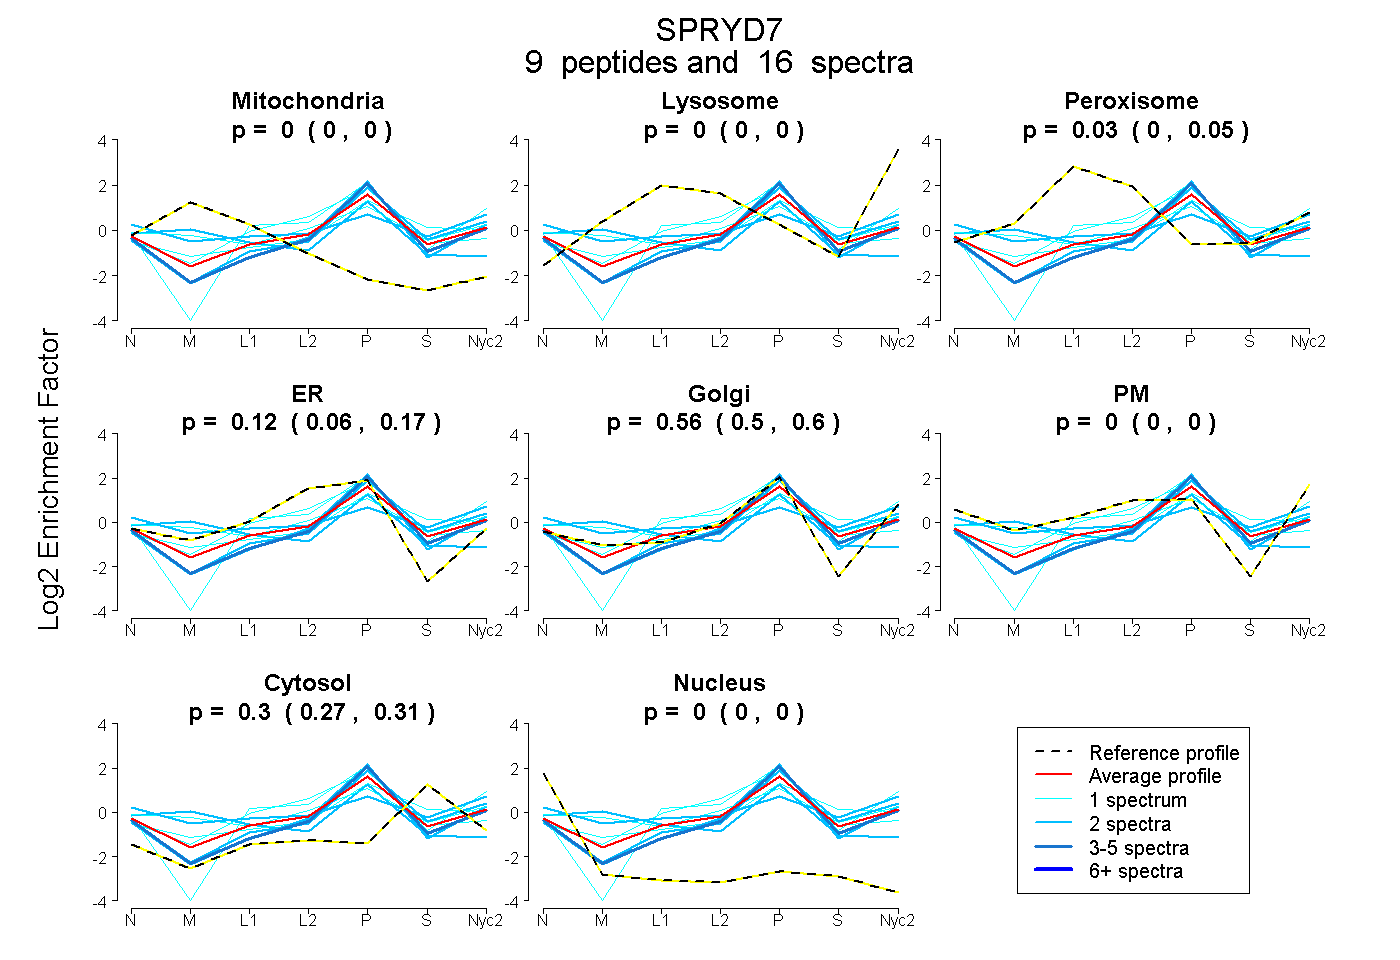
0.000 | 0.000
0.000 | 0.000
0.000 | 0.049
0.062 | 0.168
0.500 | 0.601
0.000 | 0.000
0.272 | 0.314
0.000 | 0.000
1peptide
spectrum
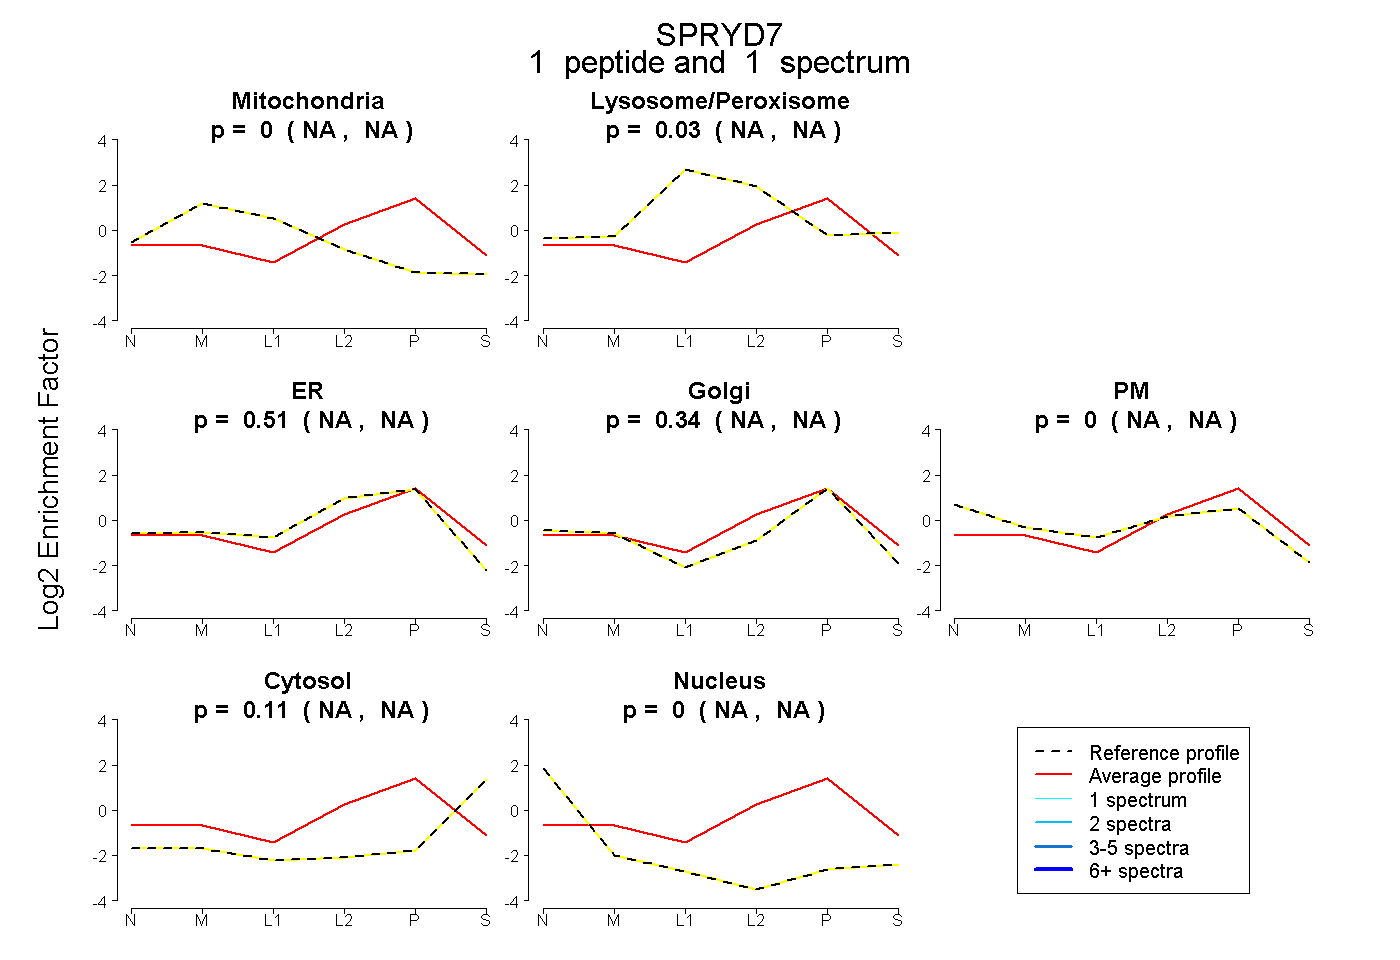
NA | NA
NA | NA
NA | NA
NA | NA
NA | NA
NA | NA
NA | NA
5peptides
spectra
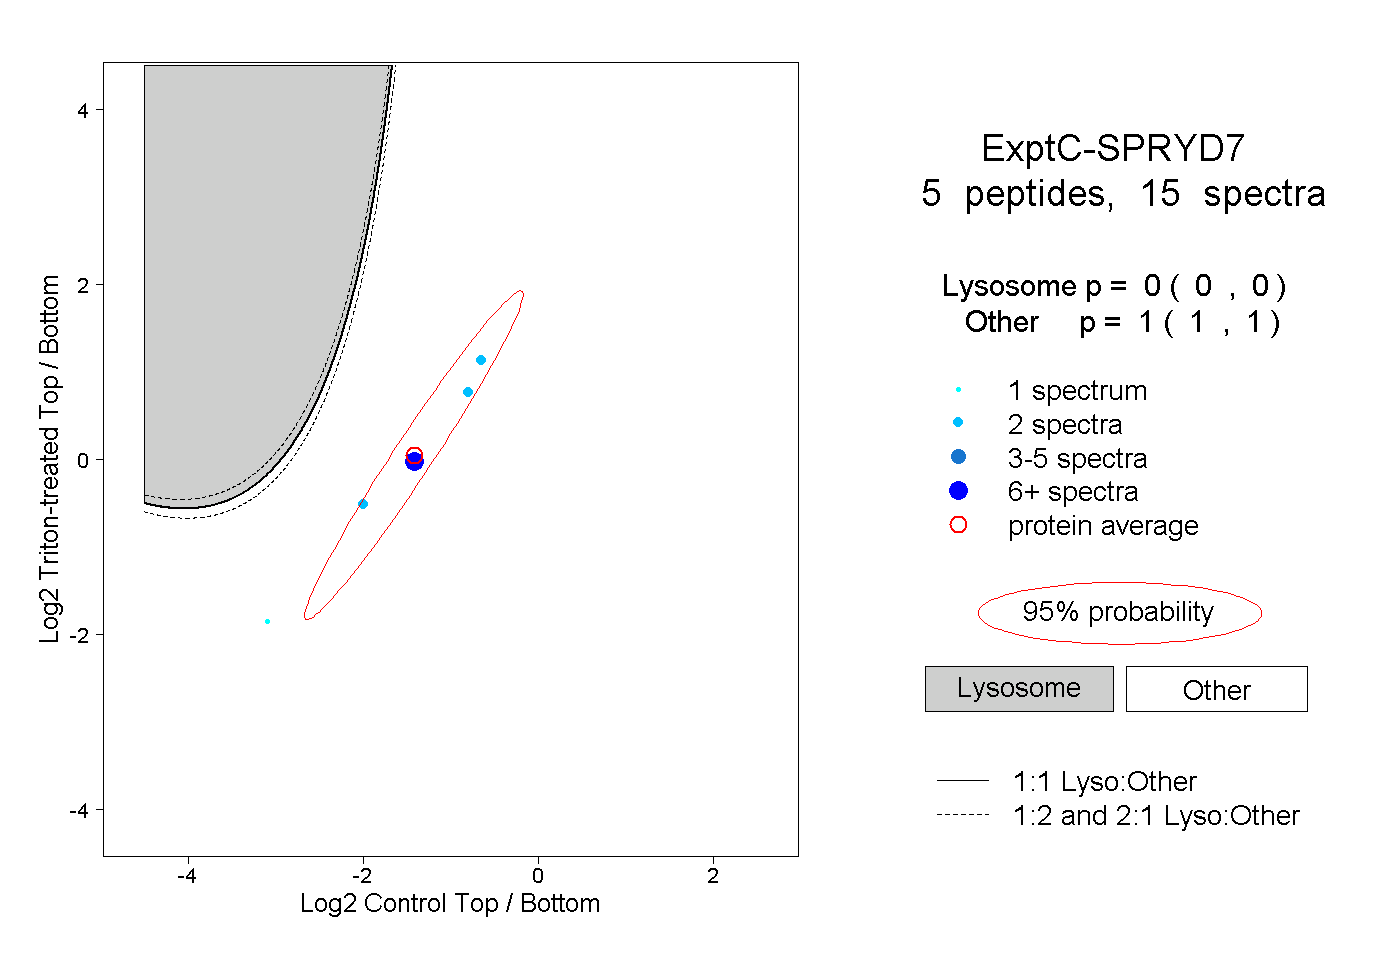
0.000 | 0.000
1.000 | 1.000
1peptide
spectrum
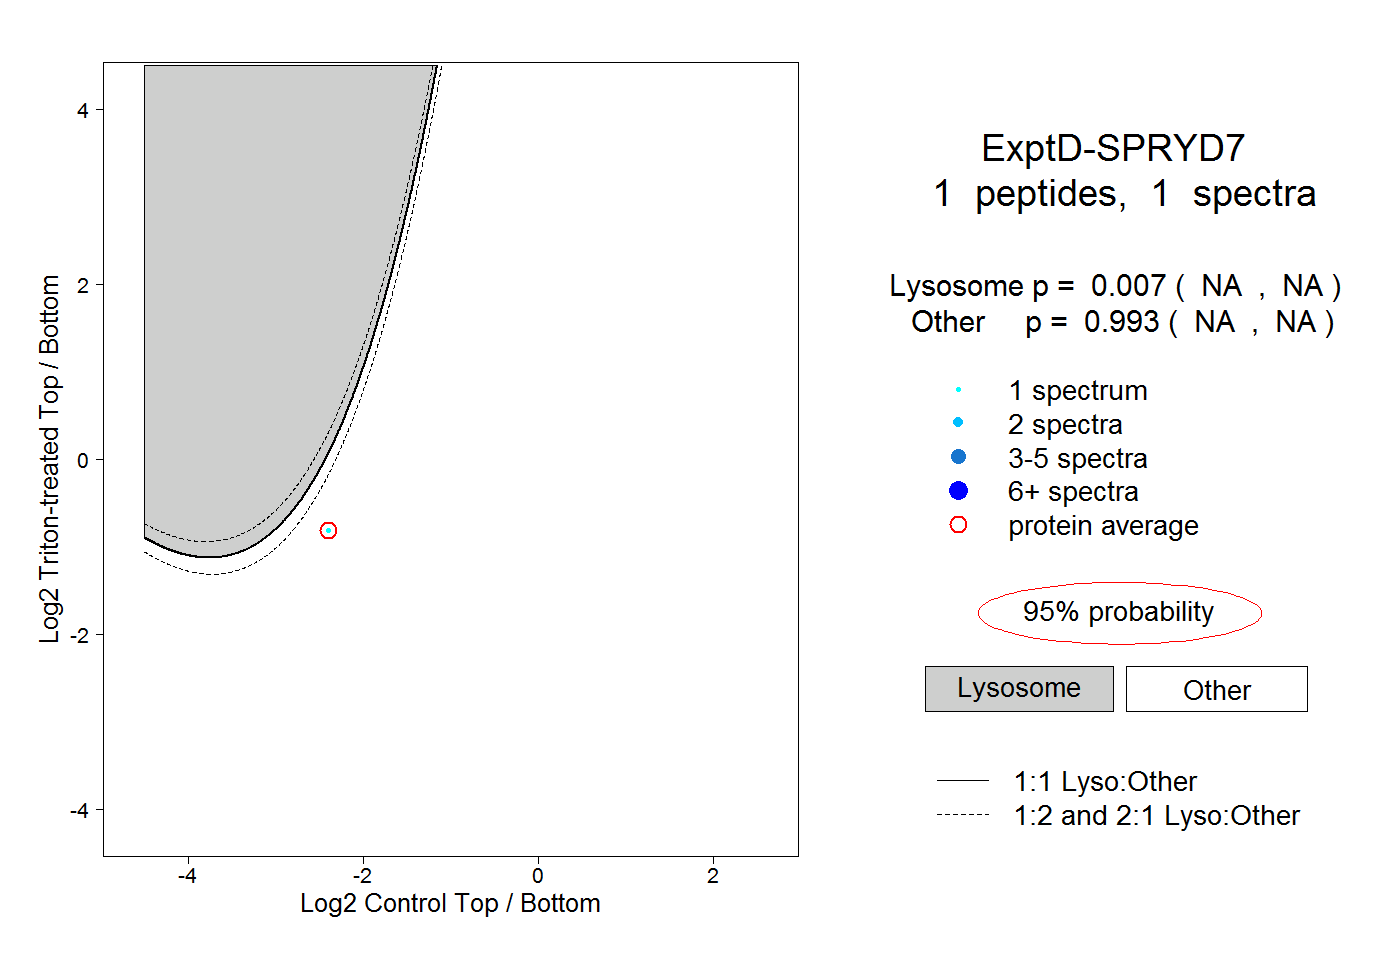
NA | NA
NA | NA