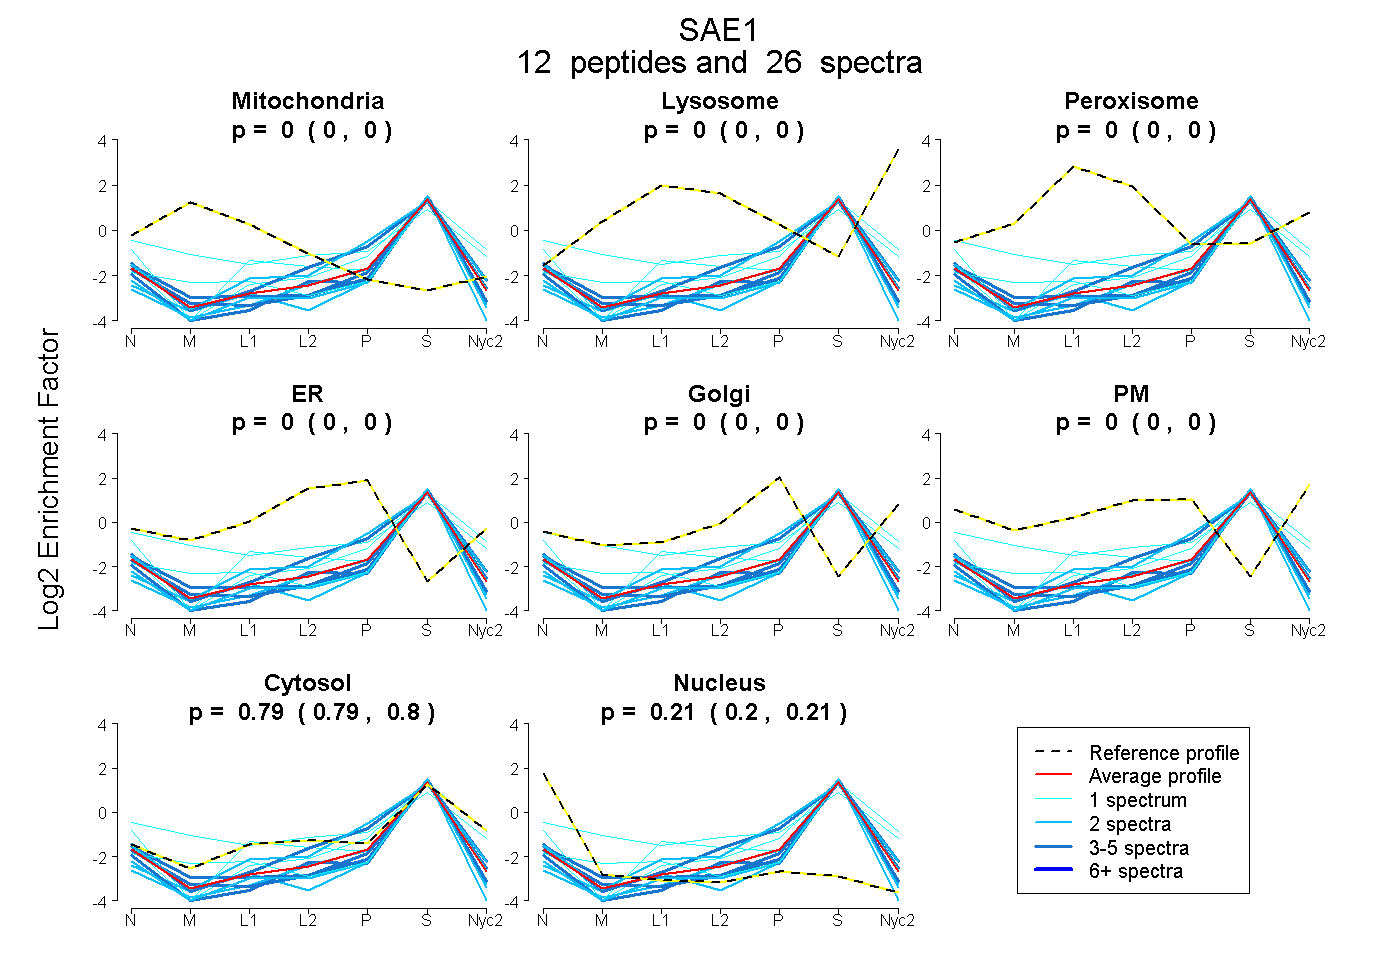
 12
12peptides
spectra
0.000 | 0.000
0.000 | 0.000
0.000 | 0.000
0.000 | 0.000
0.000 | 0.000
0.000 | 0.000
0.786 | 0.802
0.197 | 0.212
| Plot | Mito | Lyso | Perox | ER | Golgi | PM | Cytosol | Nucleus | |||||
| Expt A |
12 peptides |
26 spectra |
|
0.000 0.000 | 0.000 |
0.000 0.000 | 0.000 |
0.000 0.000 | 0.000 |
0.000 0.000 | 0.000 |
0.000 0.000 | 0.000 |
0.000 0.000 | 0.000 |
0.795 0.786 | 0.802 |
0.205 0.197 | 0.212 |
| 2 spectra, VSQGVEDGPDAK | 0.000 | 0.000 | 0.000 | 0.000 | 0.000 | 0.000 | 0.879 | 0.121 | ||
| 1 spectrum, VLIVGMK | 0.000 | 0.000 | 0.000 | 0.000 | 0.000 | 0.000 | 0.808 | 0.192 | ||
| 2 spectra, VLFCPVK | 0.000 | 0.000 | 0.000 | 0.000 | 0.000 | 0.000 | 0.708 | 0.292 | ||
| 3 spectra, VDTEDIEK | 0.000 | 0.000 | 0.000 | 0.000 | 0.000 | 0.000 | 0.845 | 0.155 | ||
| 3 spectra, NLILAGVK | 0.000 | 0.000 | 0.000 | 0.000 | 0.000 | 0.000 | 0.754 | 0.246 | ||
| 1 spectrum, LWGLEAQK | 0.000 | 0.000 | 0.000 | 0.000 | 0.000 | 0.000 | 0.934 | 0.066 | ||
| 3 spectra, EALAVDWSGEK | 0.000 | 0.000 | 0.000 | 0.000 | 0.000 | 0.000 | 0.752 | 0.248 | ||
| 1 spectrum, AEASLER | 0.000 | 0.000 | 0.000 | 0.000 | 0.000 | 0.000 | 0.794 | 0.206 | ||
| 5 spectra, TGSVGQNR | 0.000 | 0.000 | 0.000 | 0.000 | 0.000 | 0.000 | 0.784 | 0.216 | ||
| 2 spectra, AQNLNPMVDVK | 0.000 | 0.000 | 0.000 | 0.000 | 0.000 | 0.000 | 0.755 | 0.245 | ||
| 1 spectrum, GSGIVECLGPQ | 0.181 | 0.000 | 0.000 | 0.000 | 0.045 | 0.027 | 0.741 | 0.006 | ||
| 2 spectra, GLTMLDHEQVSPEDLGAQFLIR | 0.000 | 0.000 | 0.000 | 0.000 | 0.000 | 0.000 | 0.804 | 0.196 |
| Plot | Mito | Lyso or Perox | ER | Golgi | PM | Cytosol | Nucleus | ||||||
| Expt B |
1 peptide |
1 spectrum |
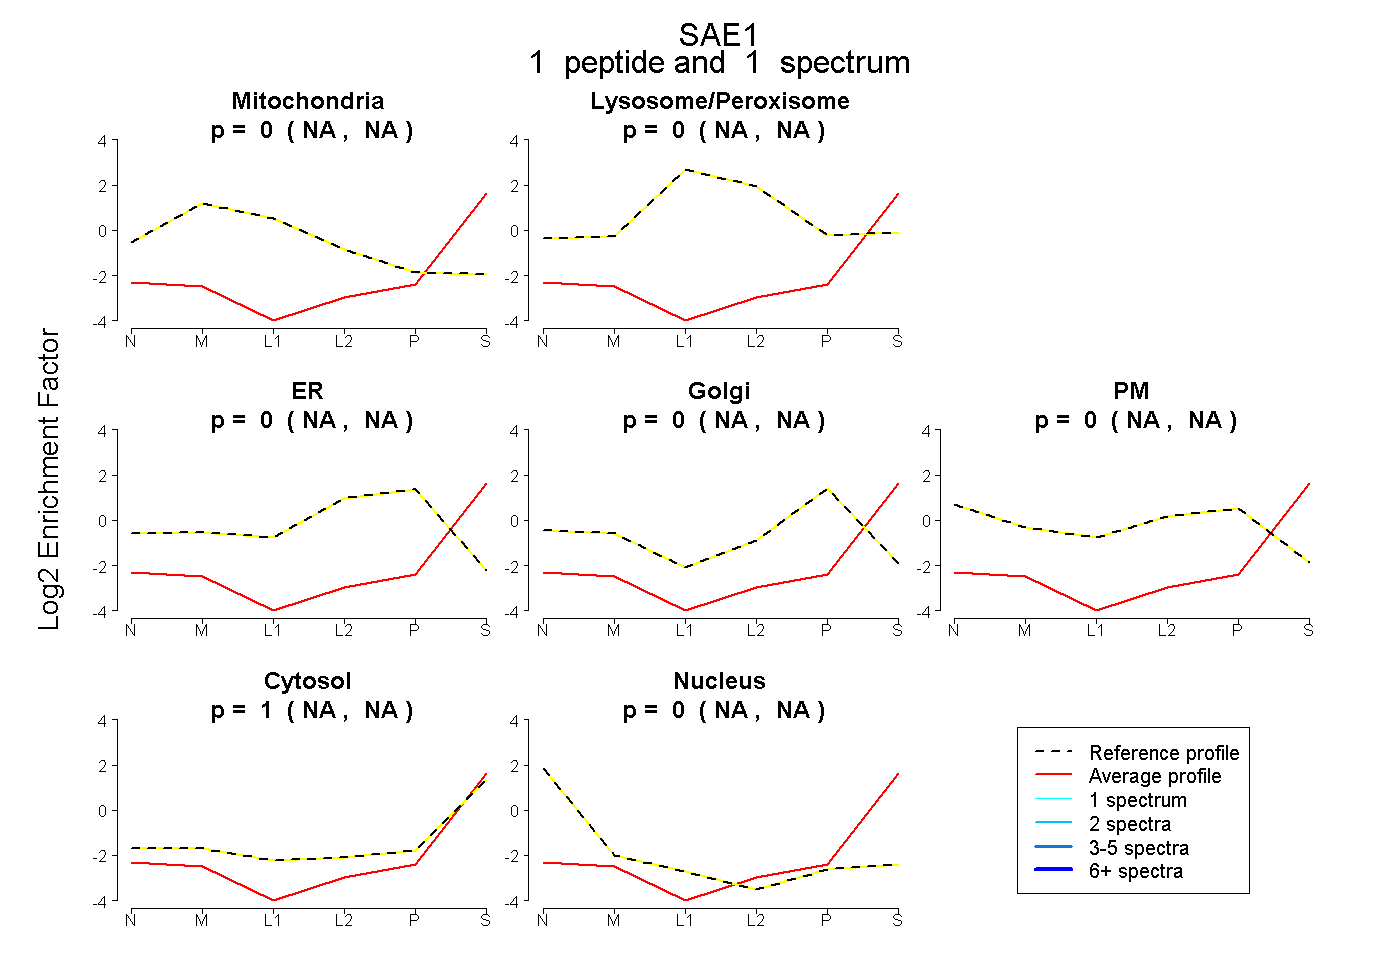 |
0.000 NA | NA |
0.000 NA | NA |
0.000 NA | NA |
0.000 NA | NA |
0.000 NA | NA |
1.000 NA | NA |
0.000 NA | NA |
|||
| Plot | Lyso | Other | |||||||||||
| Expt C |
4 peptides |
8 spectra |
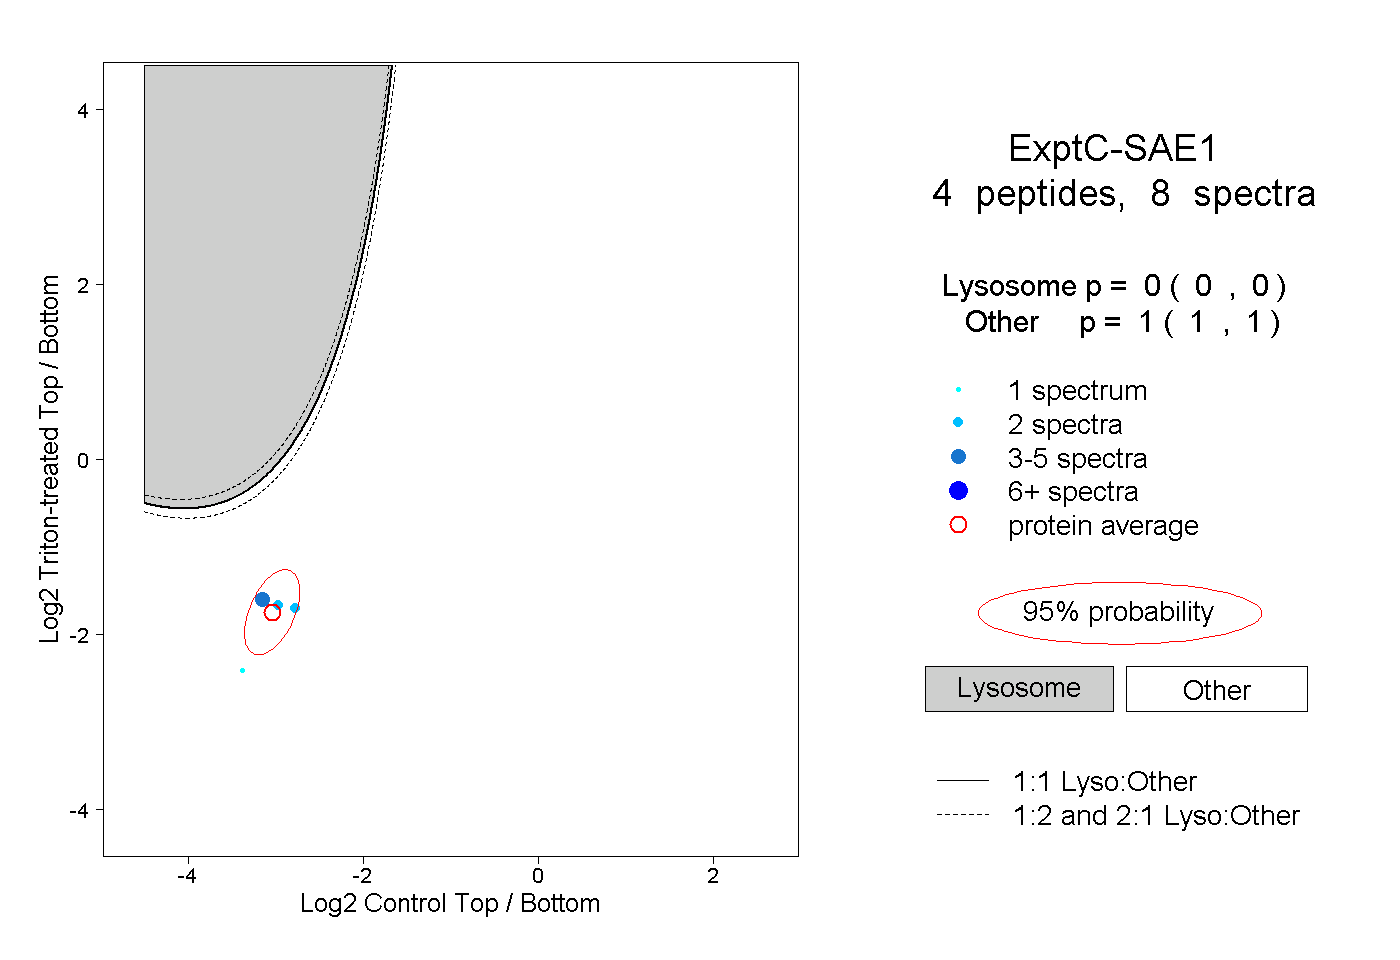 |
0.000 0.000 | 0.000 |
1.000 1.000 | 1.000 |