 12
12peptides
spectra
0.888 | 0.907
0.000 | 0.000
0.004 | 0.020
0.000 | 0.000
0.000 | 0.000
0.000 | 0.000
0.082 | 0.095
0.000 | 0.000
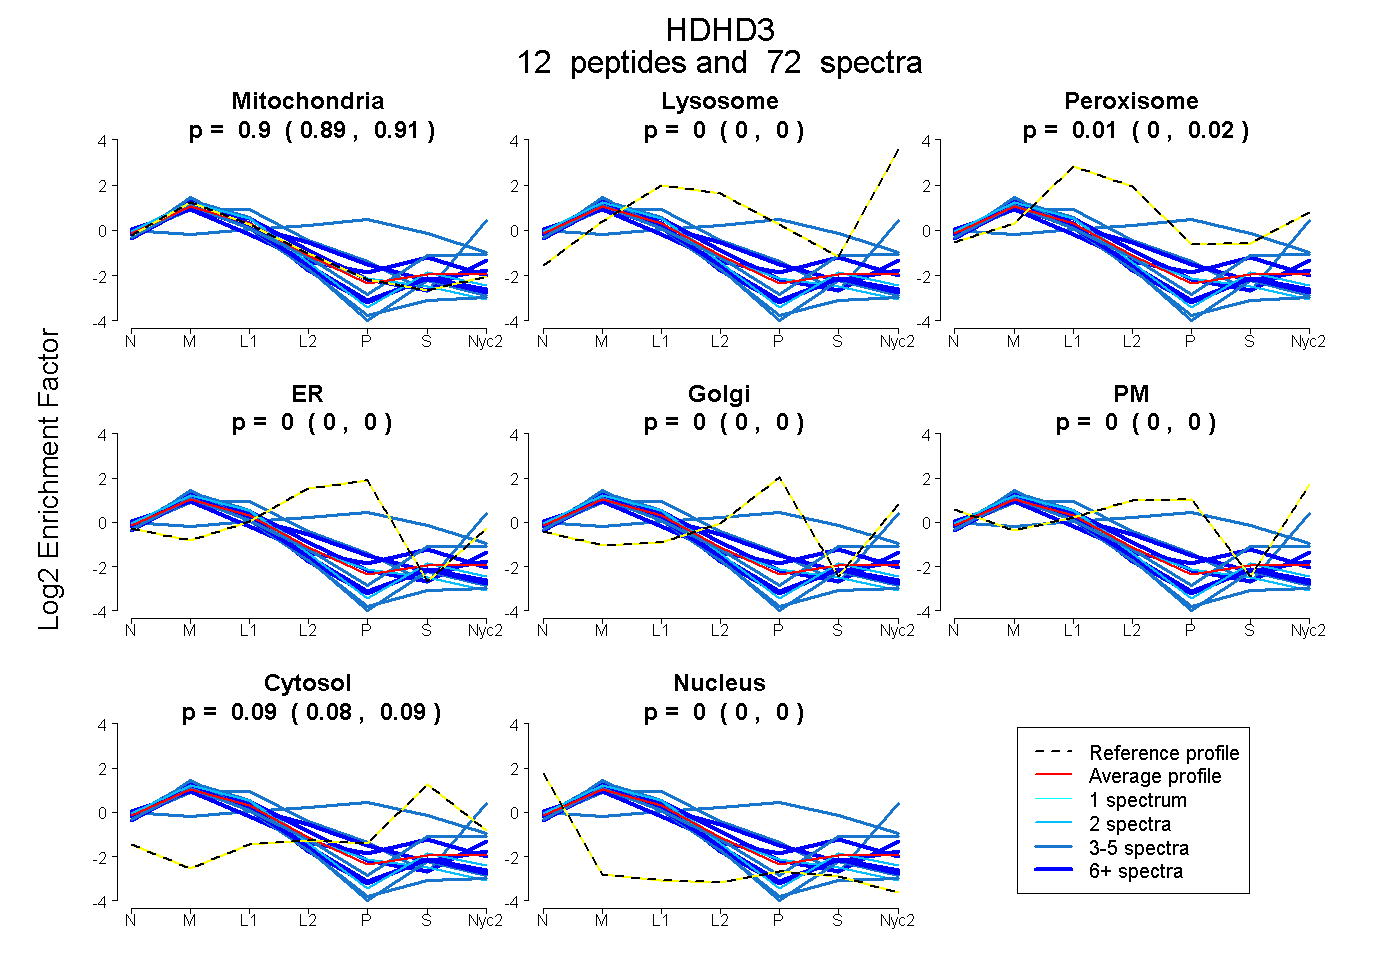
| Plot | Mito | Lyso | Perox | ER | Golgi | PM | Cytosol | Nucleus | |||||
| Expt A |
12 peptides |
72 spectra |
|
0.898 0.888 | 0.907 |
0.000 0.000 | 0.000 |
0.013 0.004 | 0.020 |
0.000 0.000 | 0.000 |
0.000 0.000 | 0.000 |
0.000 0.000 | 0.000 |
0.089 0.082 | 0.095 |
0.000 0.000 | 0.000 |
| 3 spectra, LEDILTGLGLR | 0.912 | 0.000 | 0.000 | 0.000 | 0.000 | 0.000 | 0.000 | 0.088 | ||
| 4 spectra, AHGVLVEATAVEQAFR | 0.134 | 0.000 | 0.190 | 0.353 | 0.000 | 0.000 | 0.322 | 0.000 | ||
| 2 spectra, RPVGEEYASK | 0.951 | 0.000 | 0.000 | 0.000 | 0.000 | 0.000 | 0.022 | 0.027 | ||
| 7 spectra, LAVVSNFDR | 0.929 | 0.000 | 0.000 | 0.000 | 0.000 | 0.000 | 0.000 | 0.071 | ||
| 6 spectra, LLTWDVK | 0.905 | 0.000 | 0.000 | 0.000 | 0.000 | 0.000 | 0.008 | 0.088 | ||
| 9 spectra, QWWMDVVLHTFR | 0.814 | 0.000 | 0.046 | 0.115 | 0.000 | 0.000 | 0.025 | 0.000 | ||
| 4 spectra, VLEGAETTLK | 0.752 | 0.034 | 0.018 | 0.000 | 0.000 | 0.000 | 0.196 | 0.000 | ||
| 2 spectra, EALQLACVEPSAAAHVGDSYR | 0.956 | 0.000 | 0.000 | 0.000 | 0.000 | 0.000 | 0.000 | 0.044 | ||
| 13 spectra, AVGMHSFLVVGAEPLDSSVR | 0.881 | 0.096 | 0.000 | 0.000 | 0.000 | 0.002 | 0.000 | 0.021 | ||
| 16 spectra, CDYQGAR | 0.782 | 0.000 | 0.000 | 0.000 | 0.000 | 0.000 | 0.210 | 0.008 | ||
| 3 spectra, EHFDFVLTSEAVGCPKPDPR | 0.940 | 0.000 | 0.000 | 0.000 | 0.000 | 0.000 | 0.000 | 0.060 | ||
| 3 spectra, AQSHSFPNYGLSLGLTSR | 0.602 | 0.273 | 0.000 | 0.000 | 0.000 | 0.126 | 0.000 | 0.000 |
| Plot | Mito | Lyso or Perox | ER | Golgi | PM | Cytosol | Nucleus | ||||||
| Expt B |
9 peptides |
66 spectra |
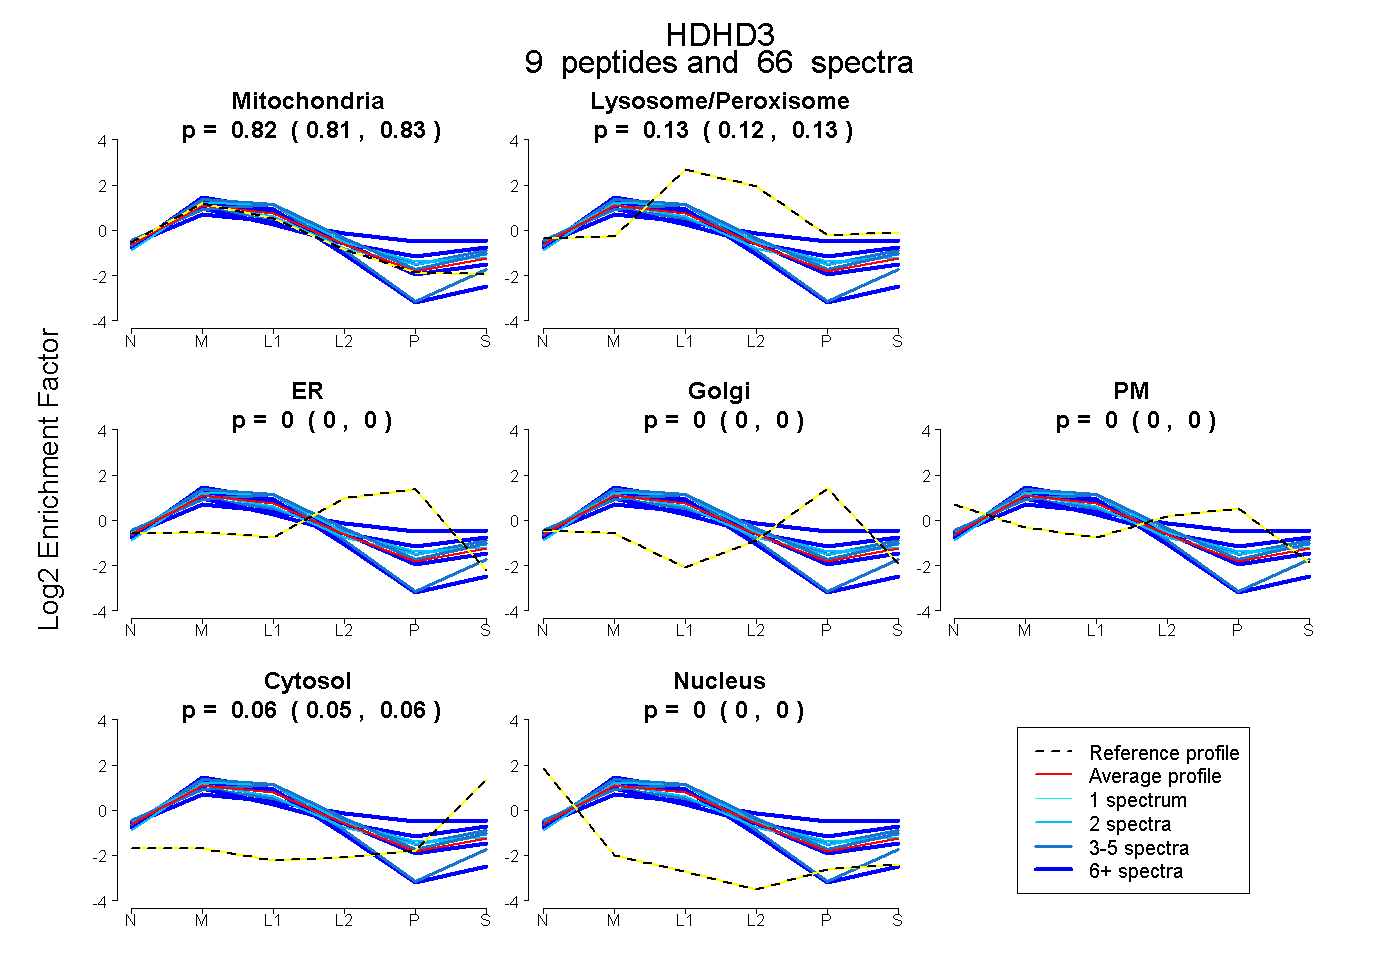 |
0.818 0.805 | 0.829 |
0.125 0.116 | 0.132 |
0.000 0.000 | 0.000 |
0.000 0.000 | 0.000 |
0.000 0.000 | 0.000 |
0.057 0.050 | 0.062 |
0.000 0.000 | 0.000 |
|||
| Plot | Lyso | Other | |||||||||||
| Expt C |
13 peptides |
218 spectra |
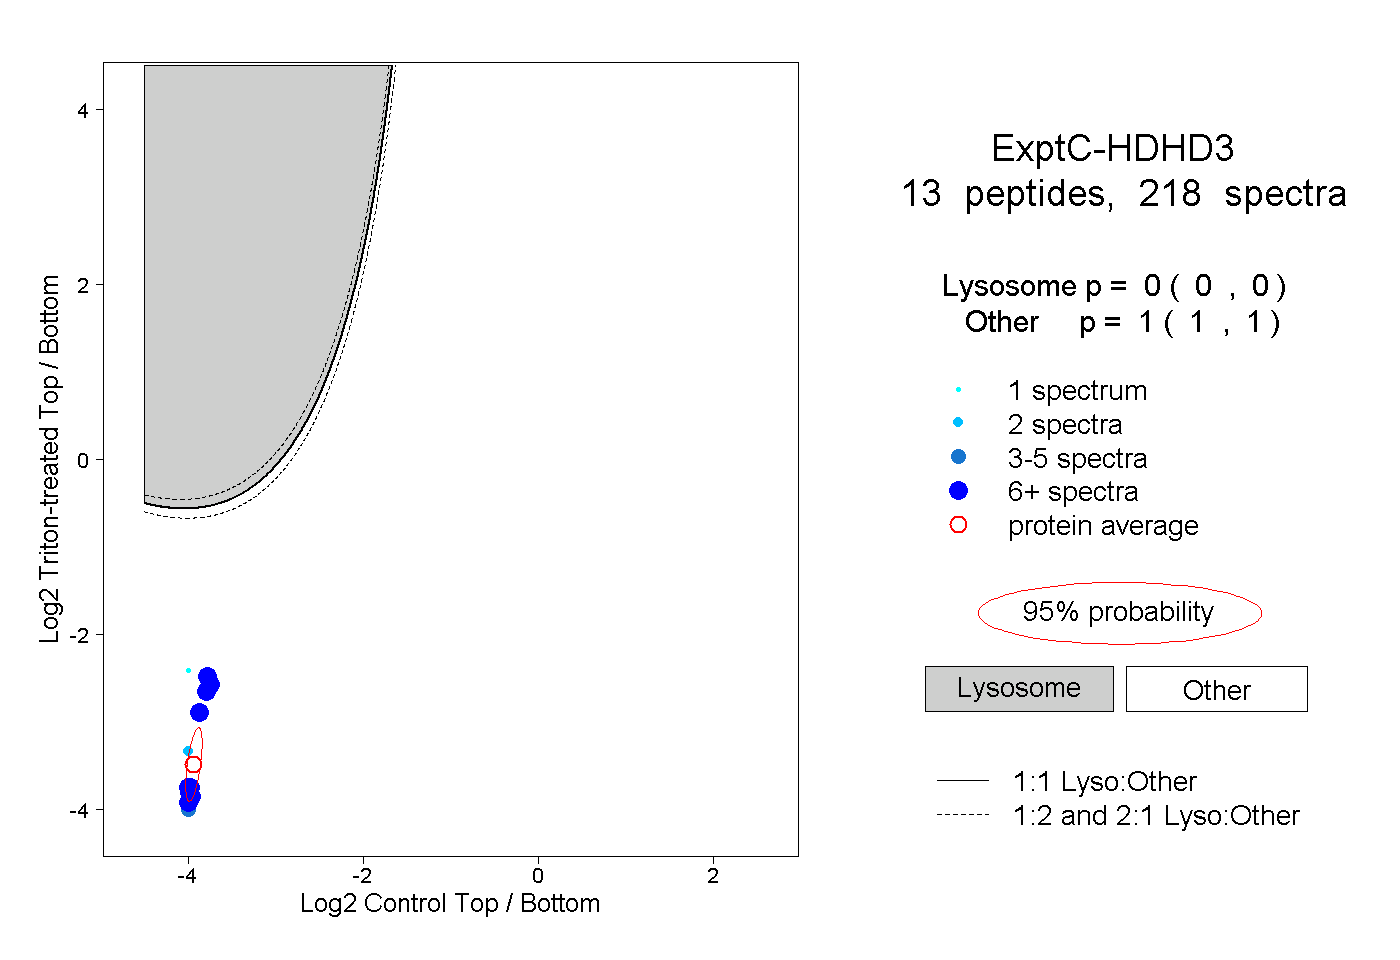 |
0.000 0.000 | 0.000 |
1.000 1.000 | 1.000 |
||||||||
| Plot | Lyso | Other | |||||||||||
| Expt D |
6 peptides |
13 spectra |
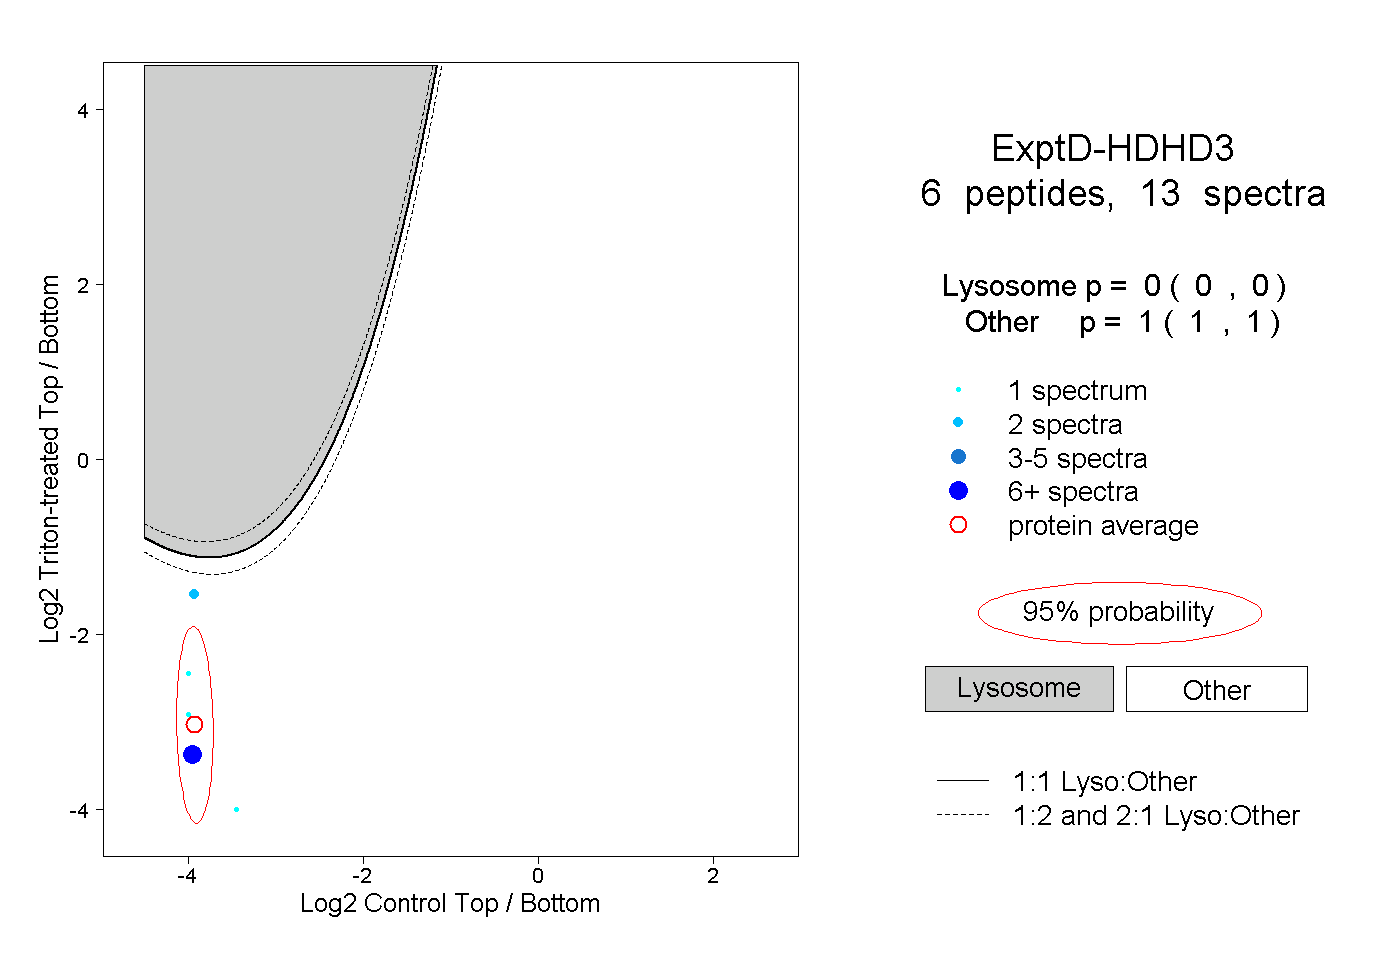 |
0.000 0.000 | 0.000 |
1.000 1.000 | 1.000 |