7
7peptides
spectra
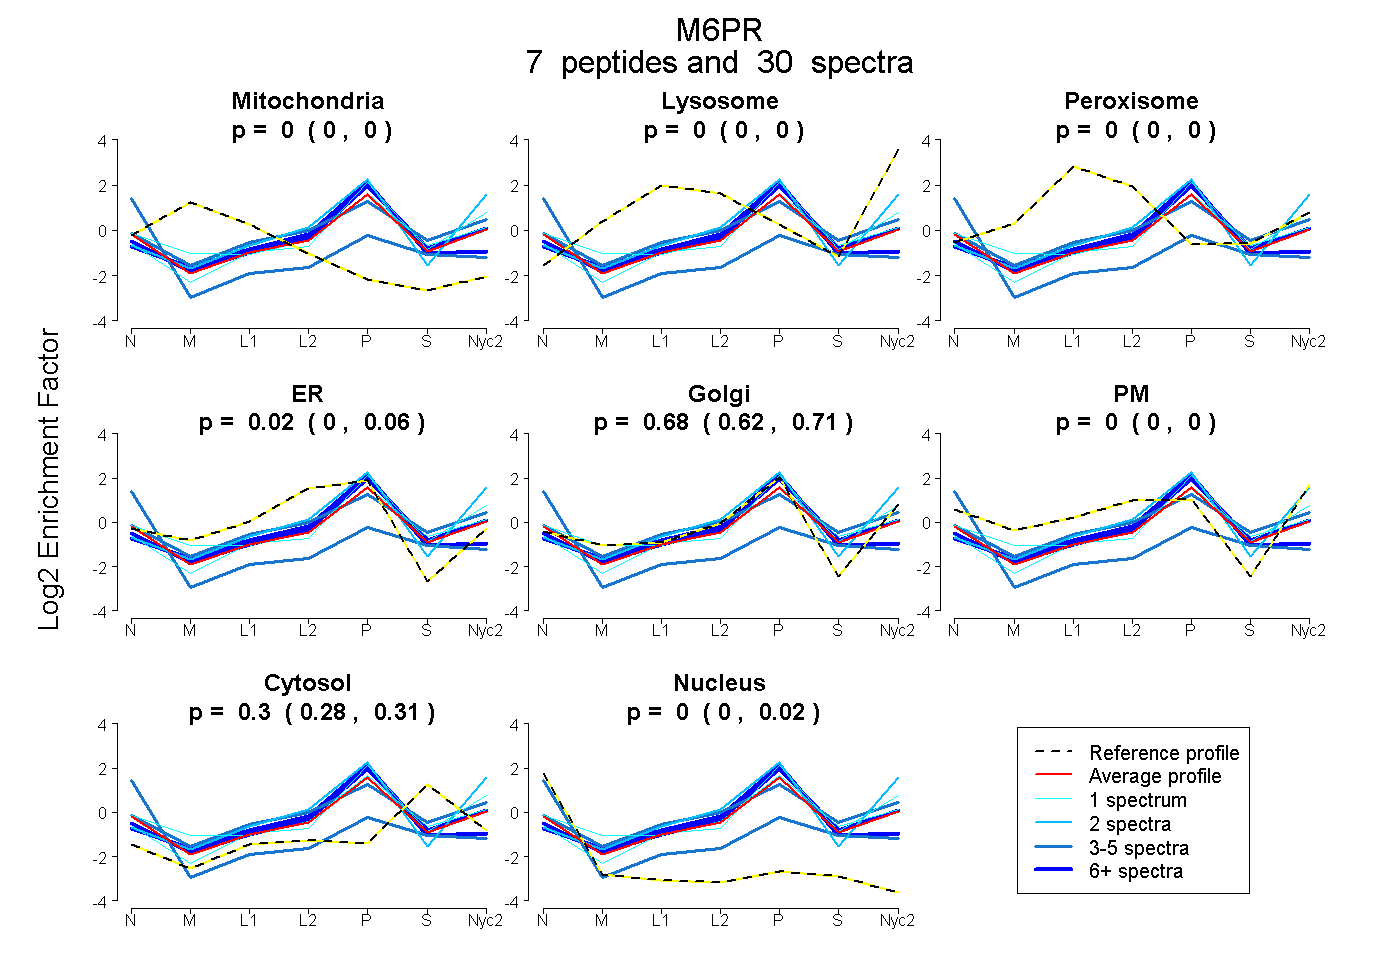
0.000 | 0.000
0.000 | 0.000
0.000 | 0.000
0.000 | 0.058
0.623 | 0.711
0.000 | 0.000
0.281 | 0.309
0.000 | 0.015
6peptides
spectra
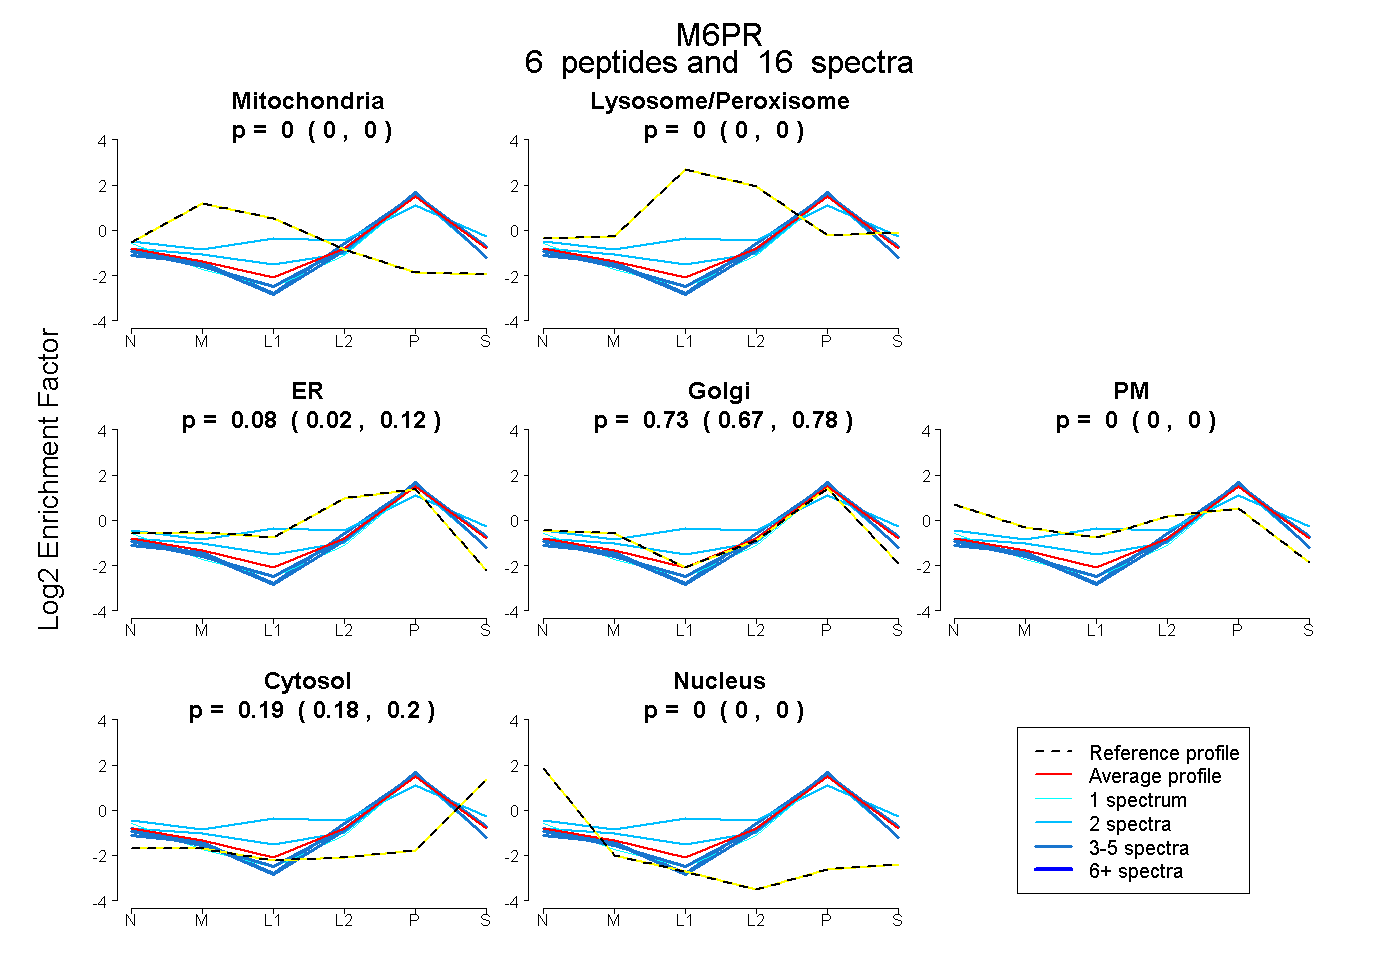
0.000 | 0.000
0.000 | 0.000
0.022 | 0.122
0.674 | 0.782
0.000 | 0.000
0.177 | 0.201
0.000 | 0.000