 7
7peptides
spectra
0.000 | 0.000
0.000 | 0.000
0.000 | 0.000
0.000 | 0.058
0.623 | 0.711
0.000 | 0.000
0.281 | 0.309
0.000 | 0.015
| Plot | Mito | Lyso | Perox | ER | Golgi | PM | Cytosol | Nucleus | |||||
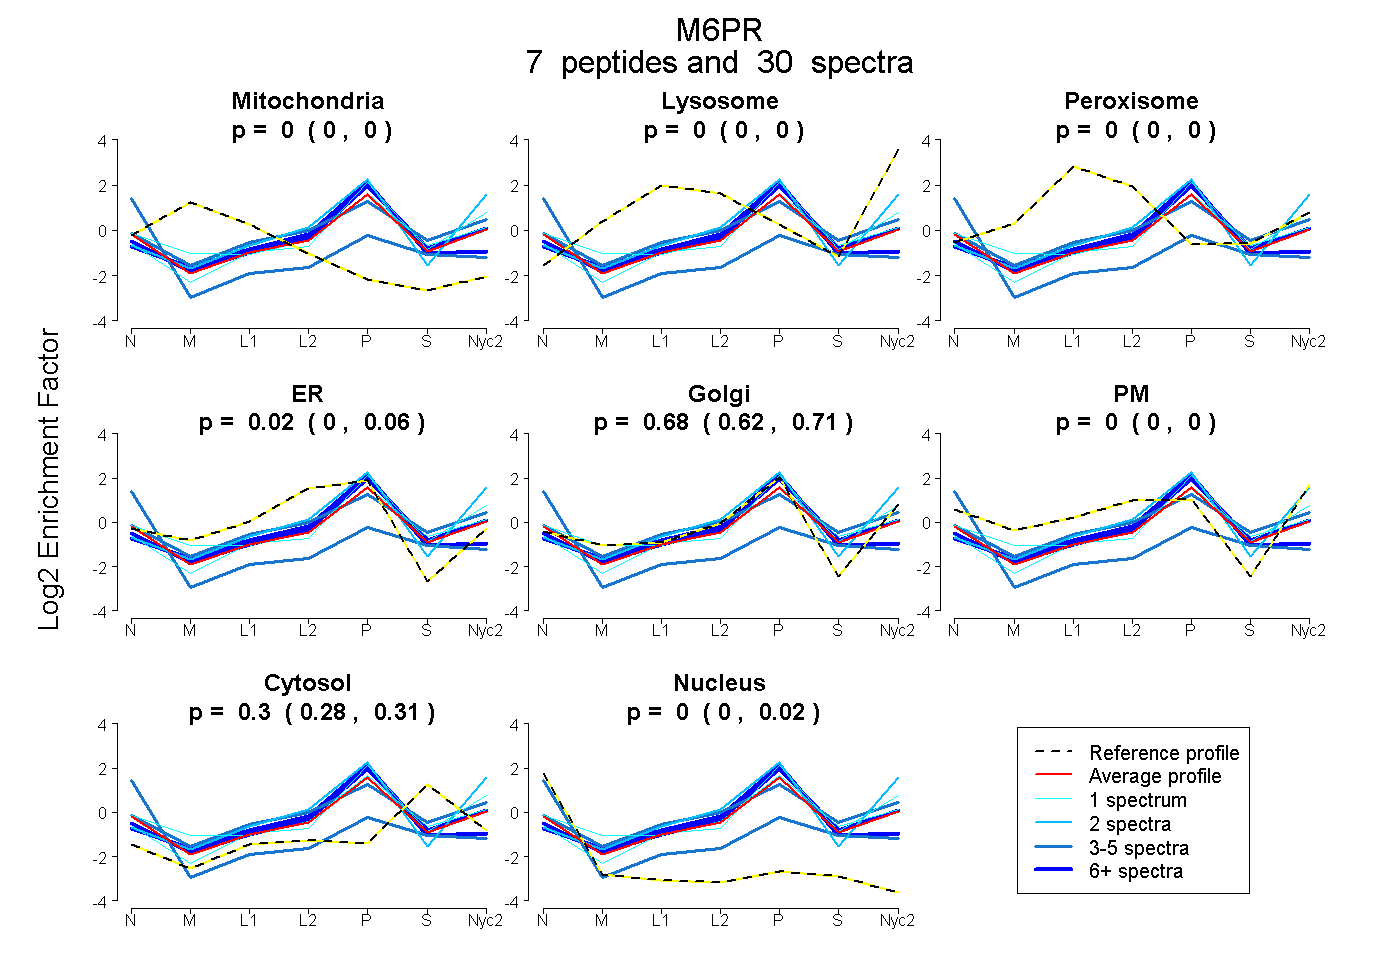
| Expt A |
7 peptides |
30 spectra |
|
0.000 0.000 | 0.000 |
0.000 0.000 | 0.000 |
0.000 0.000 | 0.000 |
0.021 0.000 | 0.058 |
0.678 0.623 | 0.711 |
0.000 0.000 | 0.000 |
0.298 0.281 | 0.309 |
0.003 0.000 | 0.015 |
| 4 spectra, LVVGAK | 0.000 | 0.000 | 0.000 | 0.000 | 0.253 | 0.073 | 0.256 | 0.418 | ||
| 1 spectrum, SFESTVGQGSDTYSYIFR | 0.000 | 0.000 | 0.000 | 0.000 | 0.744 | 0.000 | 0.256 | 0.000 | ||
| 12 spectra, AVVMISCNR | 0.000 | 0.000 | 0.000 | 0.363 | 0.346 | 0.000 | 0.287 | 0.004 | ||
| 1 spectrum, SVPAAYR | 0.000 | 0.000 | 0.006 | 0.015 | 0.700 | 0.000 | 0.280 | 0.000 | ||
| 2 spectra, NEVALLER | 0.000 | 0.119 | 0.000 | 0.000 | 0.820 | 0.000 | 0.061 | 0.000 | ||
| 7 spectra, GGDEYDNHCGK | 0.000 | 0.000 | 0.000 | 0.019 | 0.709 | 0.000 | 0.272 | 0.000 | ||
| 3 spectra, HTLAGNFNPVSEER | 0.000 | 0.000 | 0.067 | 0.019 | 0.461 | 0.137 | 0.316 | 0.000 |
| Plot | Mito | Lyso or Perox | ER | Golgi | PM | Cytosol | Nucleus | ||||||
| Expt B |
6 peptides |
16 spectra |
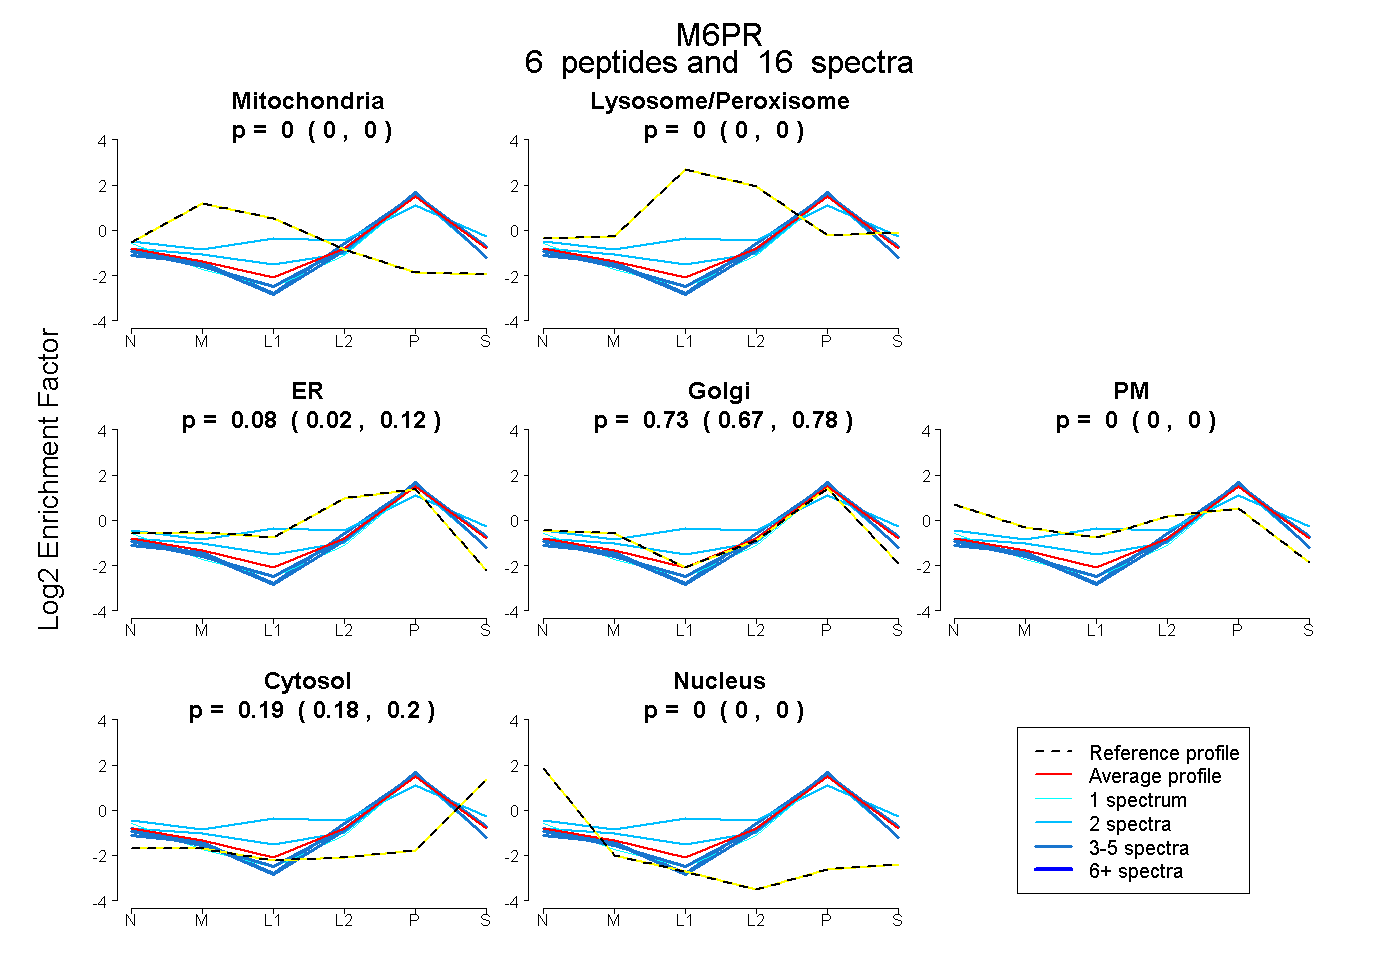 |
0.000 0.000 | 0.000 |
0.000 0.000 | 0.000 |
0.077 0.022 | 0.122 |
0.733 0.674 | 0.782 |
0.000 0.000 | 0.000 |
0.190 0.177 | 0.201 |
0.000 0.000 | 0.000 |
|||
| Plot | Lyso | Other | |||||||||||
| Expt C |
6 peptides |
46 spectra |
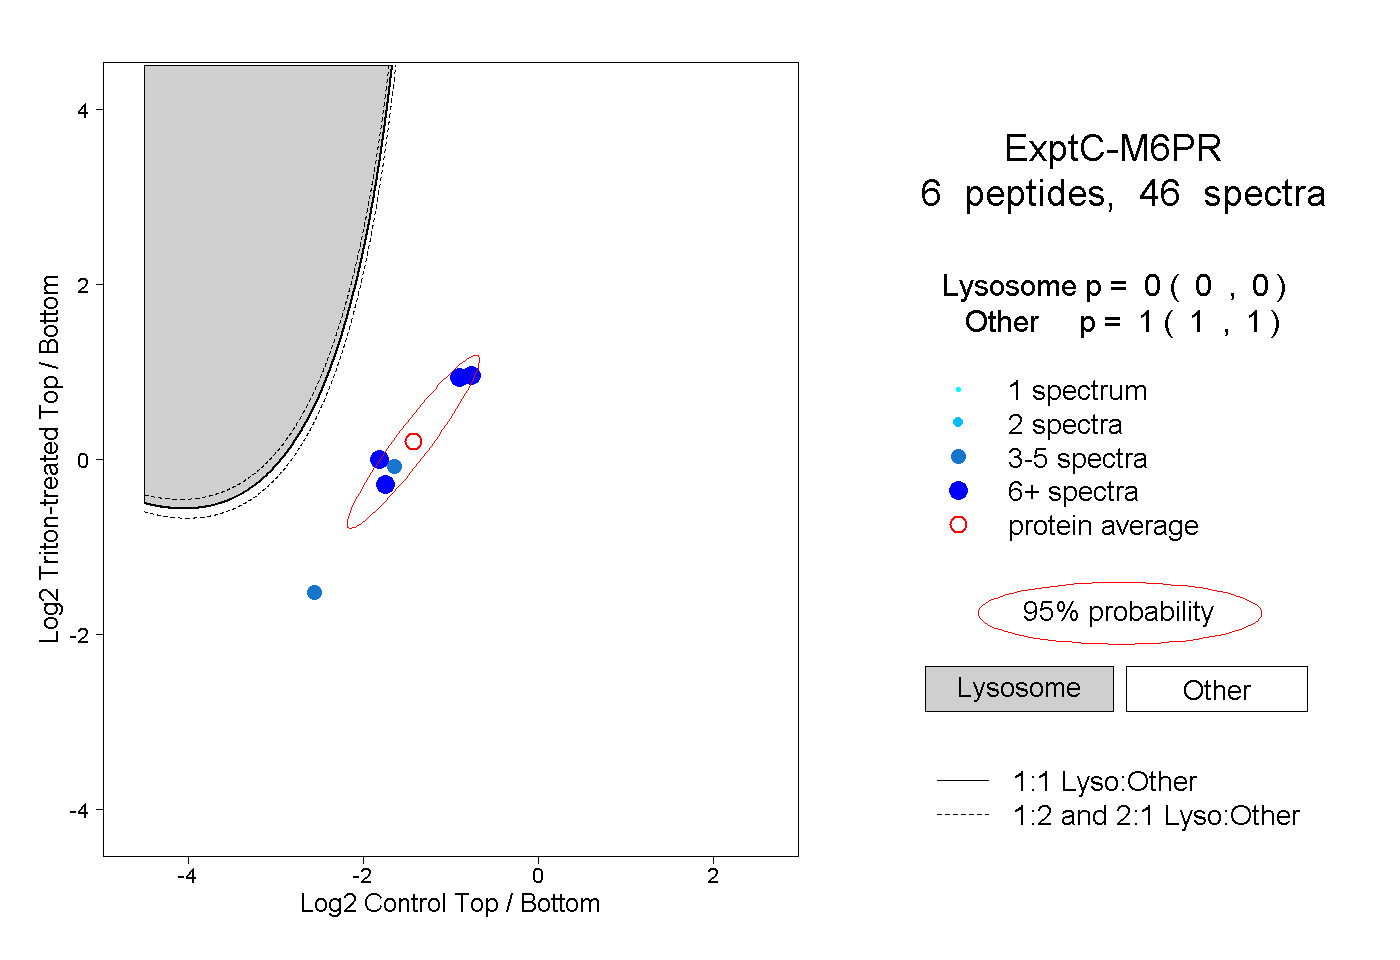 |
0.000 0.000 | 0.000 |
1.000 1.000 | 1.000 |