 2
2peptides
spectra
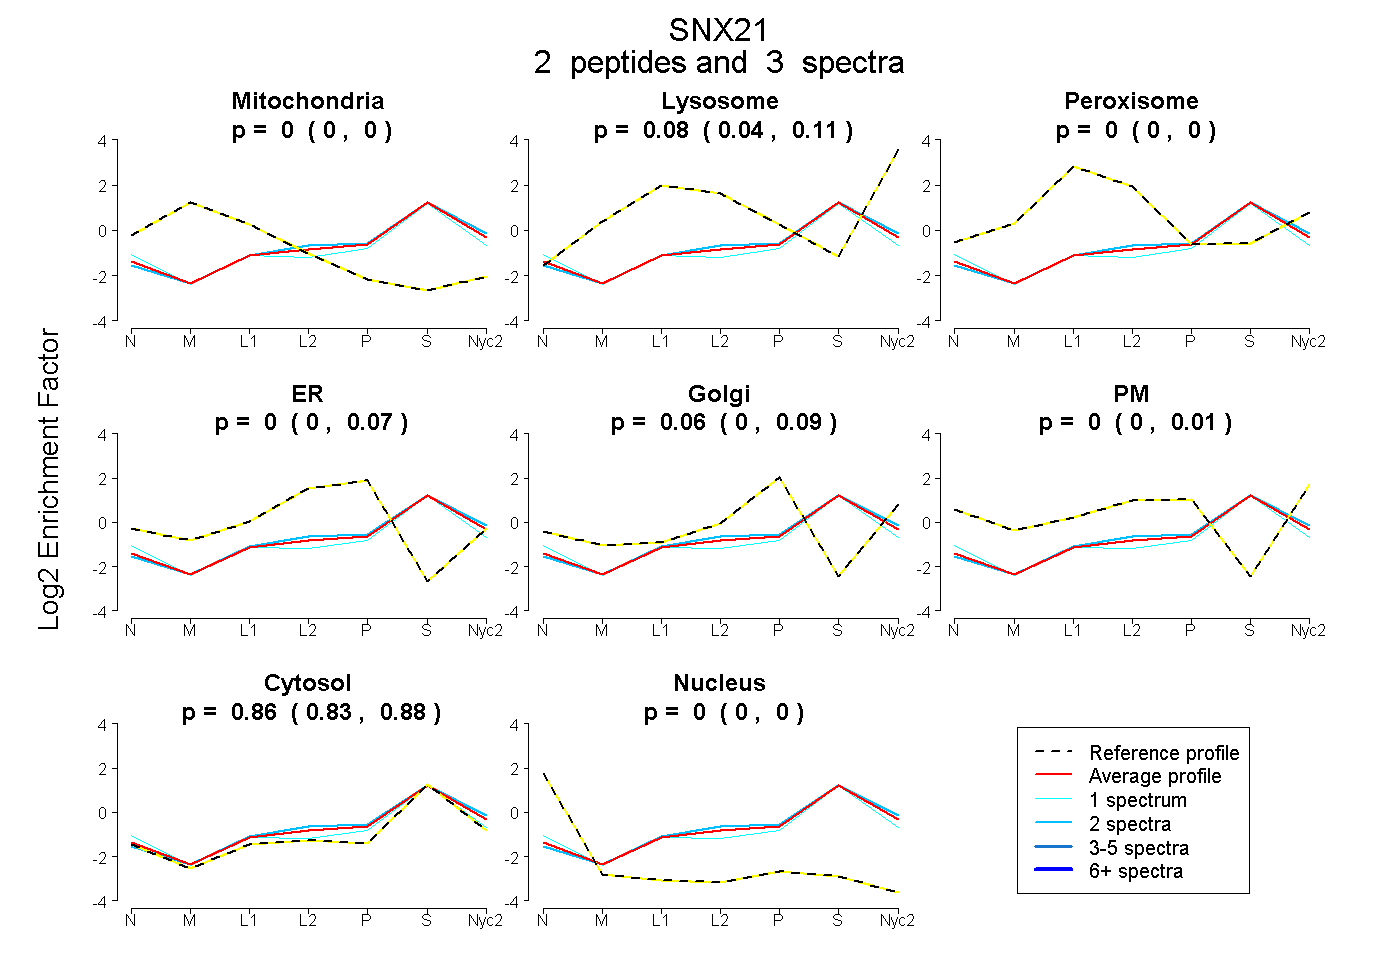
0.000 | 0.000
0.036 | 0.106
0.000 | 0.000
0.000 | 0.070
0.000 | 0.085
0.000 | 0.009
0.835 | 0.878
0.000 | 0.000
| Plot | Mito | Lyso | Perox | ER | Golgi | PM | Cytosol | Nucleus | |||||
| Expt A |
2 peptides |
3 spectra |
|
0.000 0.000 | 0.000 |
0.081 0.036 | 0.106 |
0.000 0.000 | 0.000 |
0.000 0.000 | 0.070 |
0.062 0.000 | 0.085 |
0.000 0.000 | 0.009 |
0.857 0.835 | 0.878 |
0.000 0.000 | 0.000 |
| 2 spectra, AFEQFLGHLQAVPELR | 0.000 | 0.115 | 0.000 | 0.000 | 0.048 | 0.000 | 0.837 | 0.000 | ||
| 1 spectrum, QPAQISR | 0.000 | 0.000 | 0.030 | 0.000 | 0.081 | 0.000 | 0.890 | 0.000 |
| Plot | Lyso | Other | |||||||||||
| Expt C |
1 peptide |
1 spectrum |
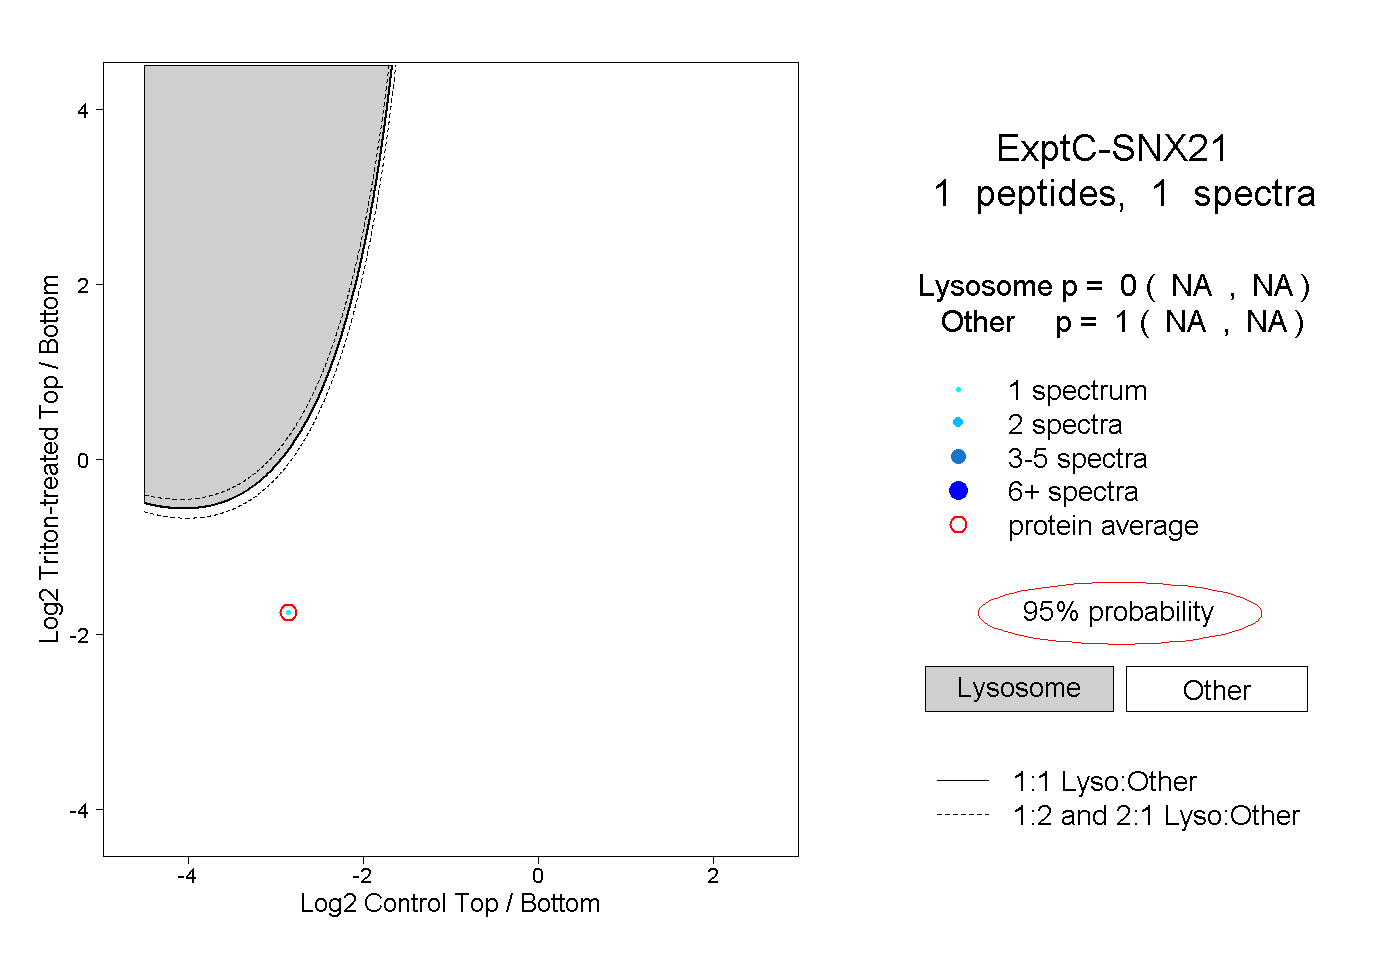 |
0.000 NA | NA |
1.000 NA | NA |