 3
3peptides
spectra
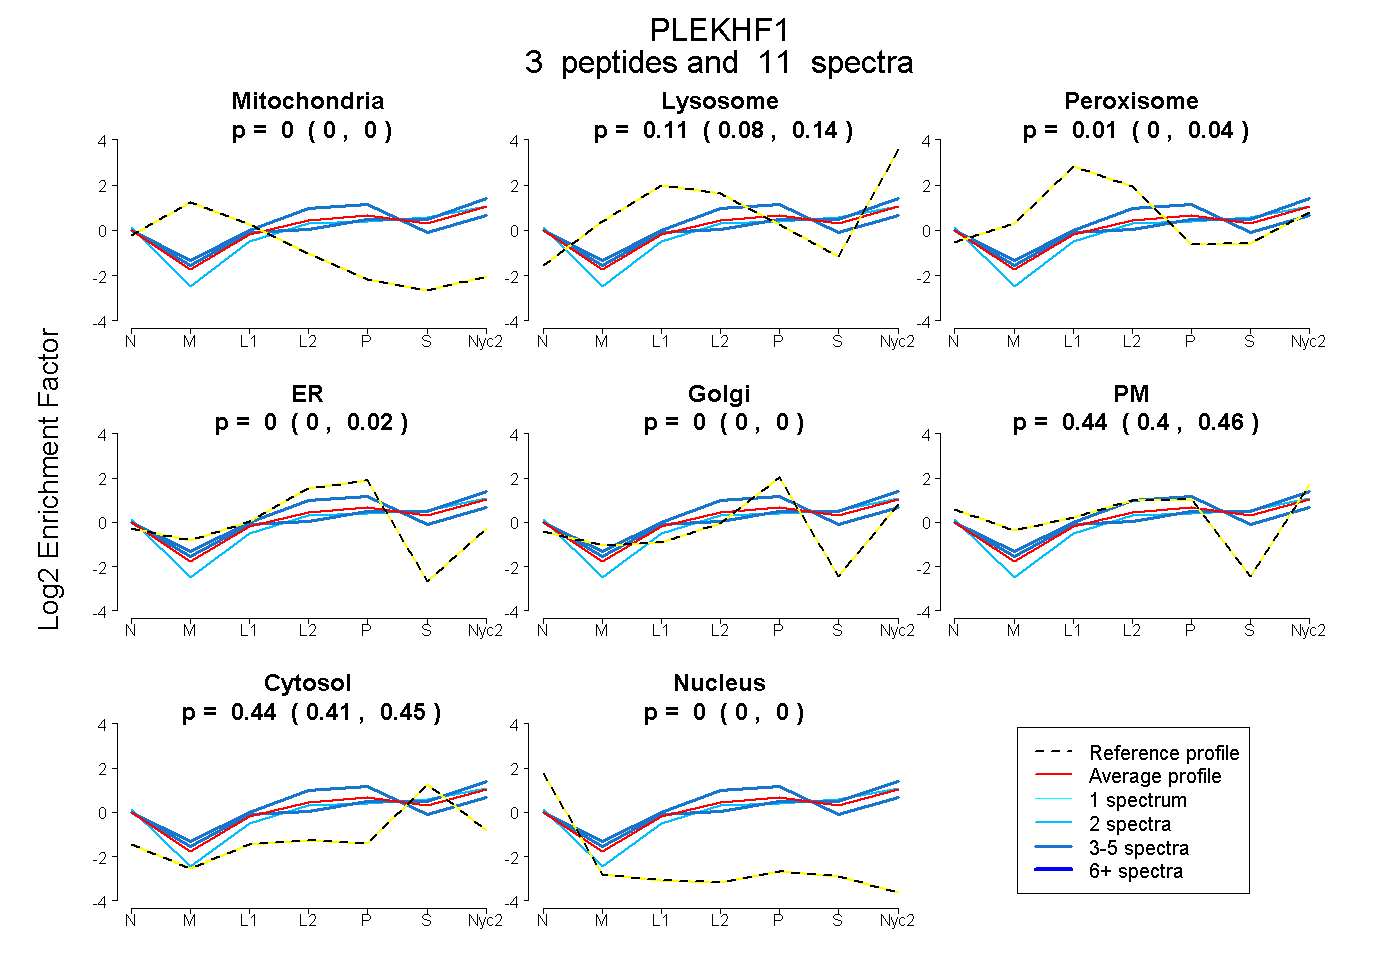
0.000 | 0.000
0.078 | 0.138
0.000 | 0.041
0.000 | 0.024
0.000 | 0.000
0.403 | 0.457
0.415 | 0.455
0.000 | 0.000
1peptide
spectrum
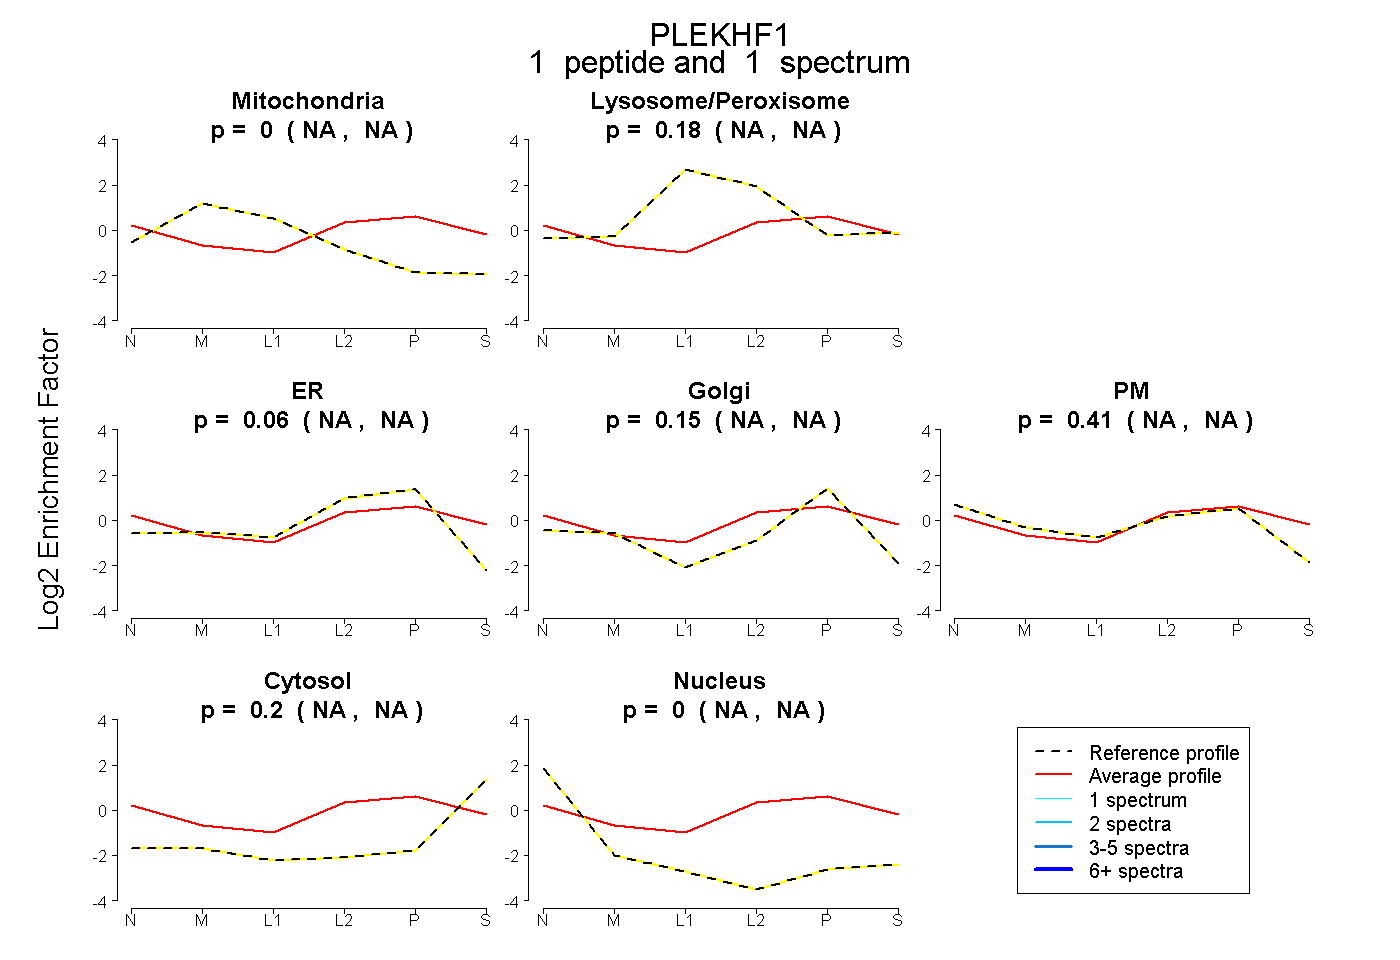
NA | NA
NA | NA
NA | NA
NA | NA
NA | NA
NA | NA
NA | NA
5peptides
spectra
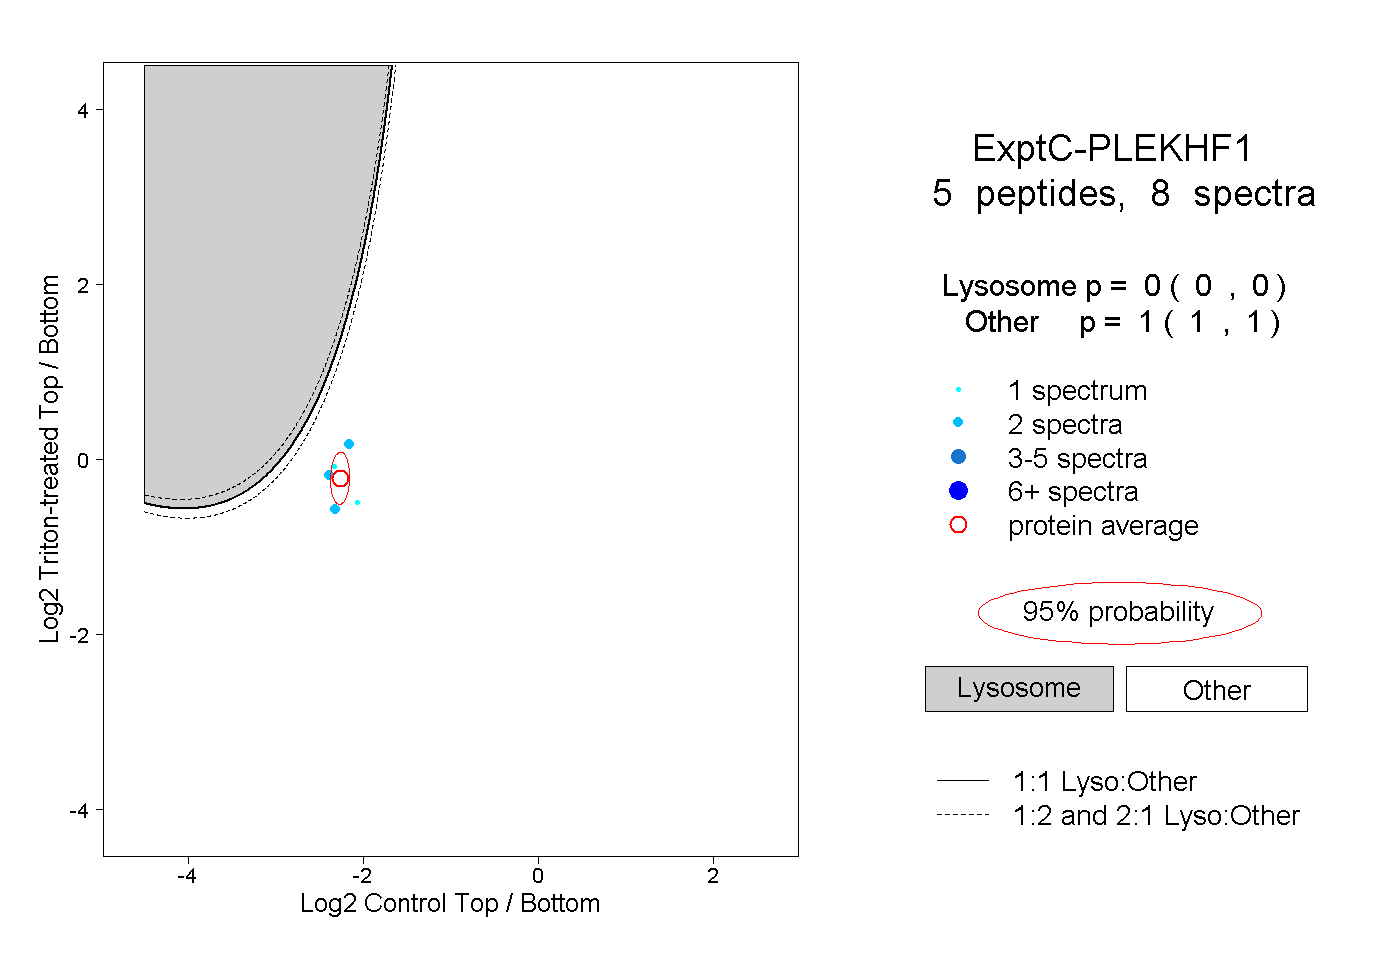
0.000 | 0.000
1.000 | 1.000
3peptides
spectra
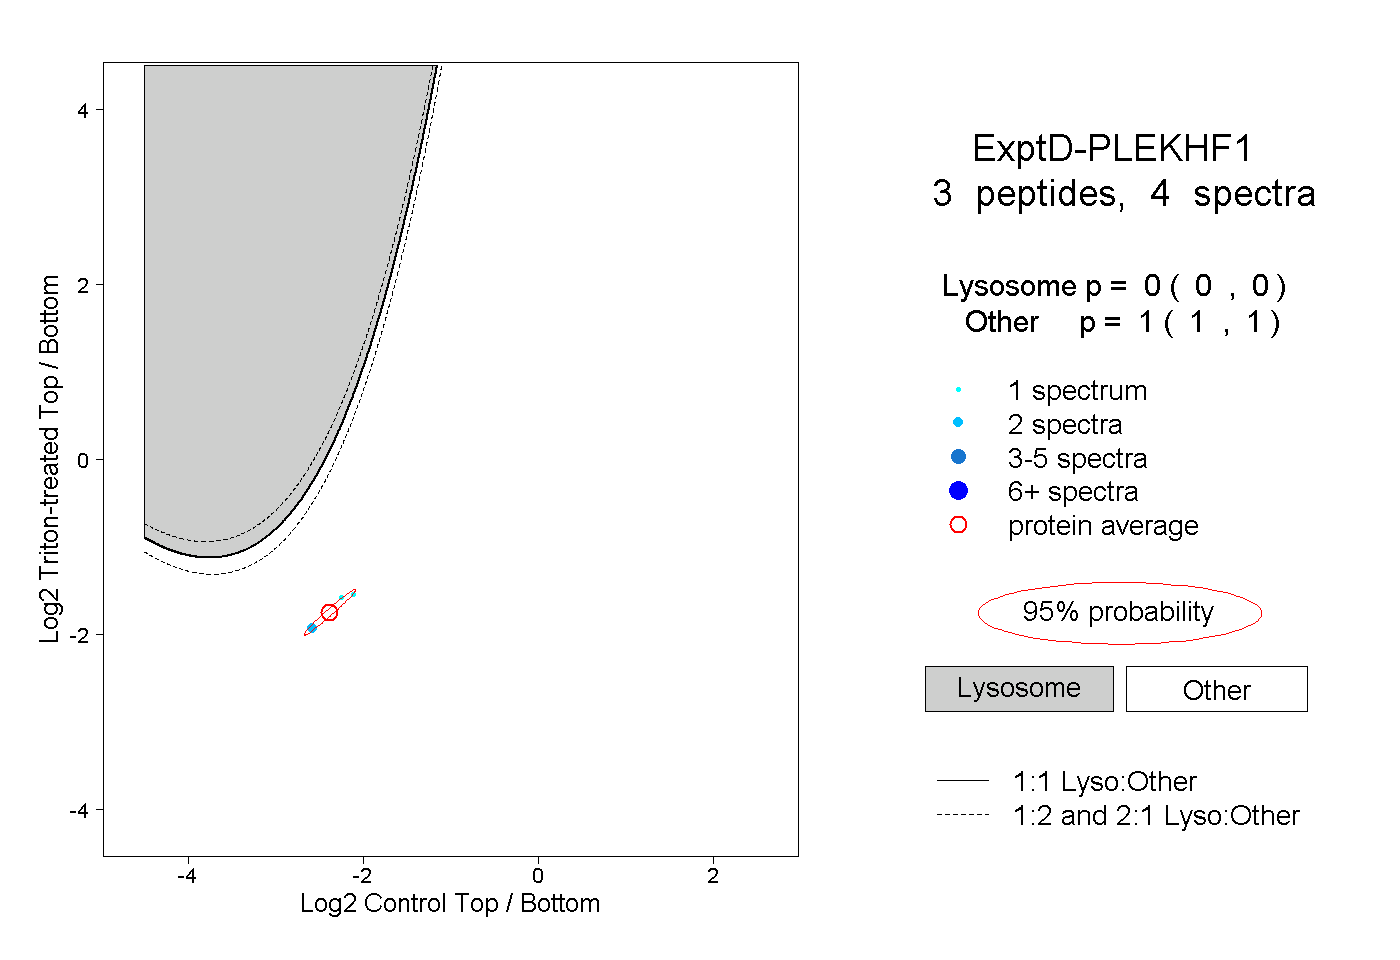
0.000 | 0.000
1.000 | 1.000