15
15peptides
spectra
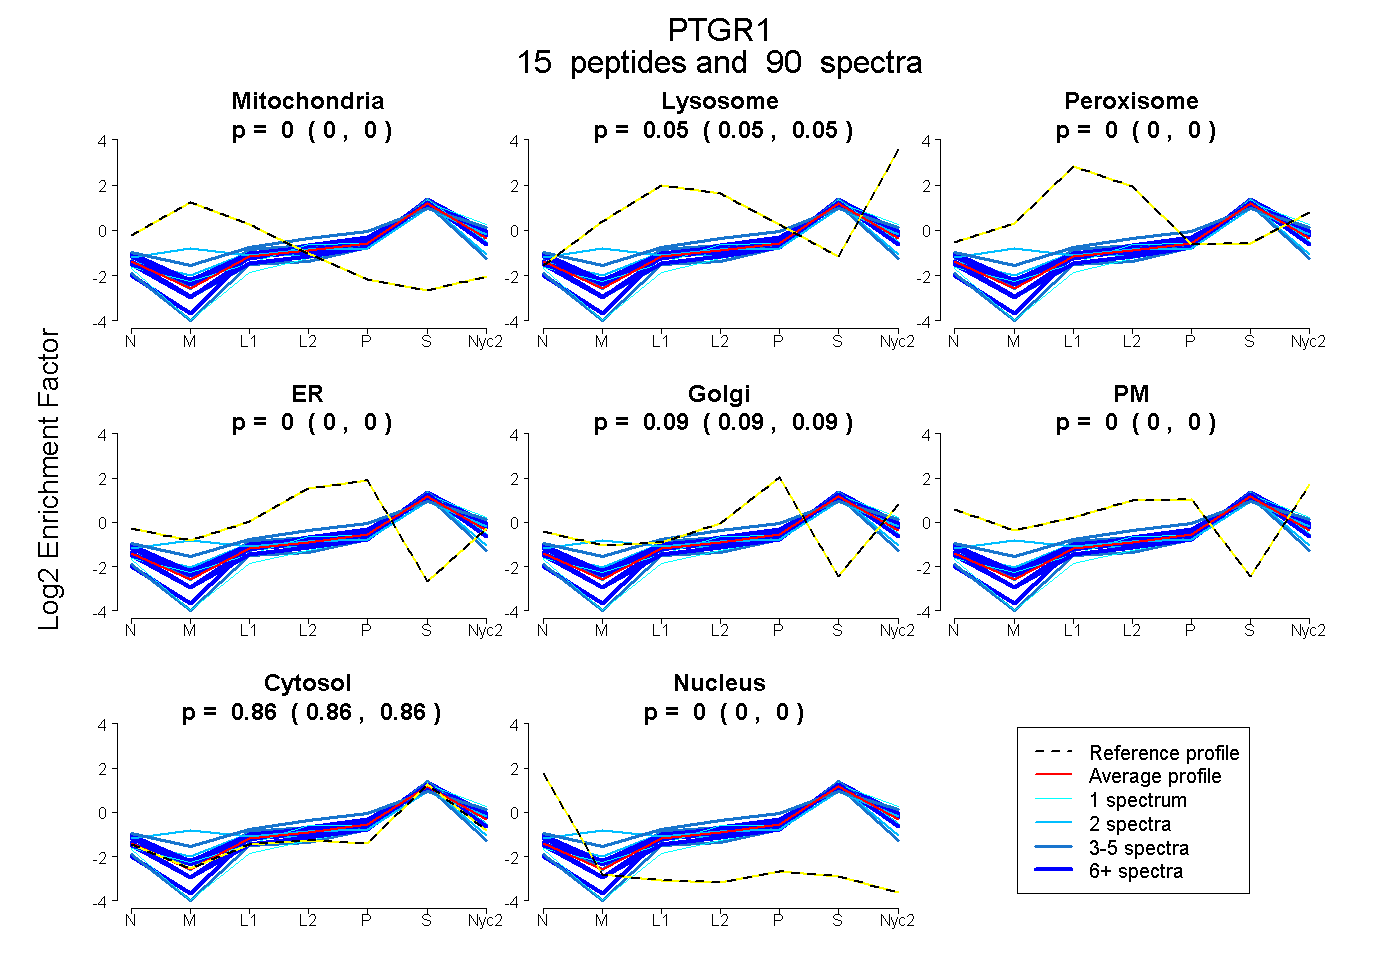
0.000 | 0.000
0.046 | 0.052
0.000 | 0.000
0.000 | 0.000
0.086 | 0.091
0.000 | 0.000
0.859 | 0.863
0.000 | 0.000
8peptides
spectra
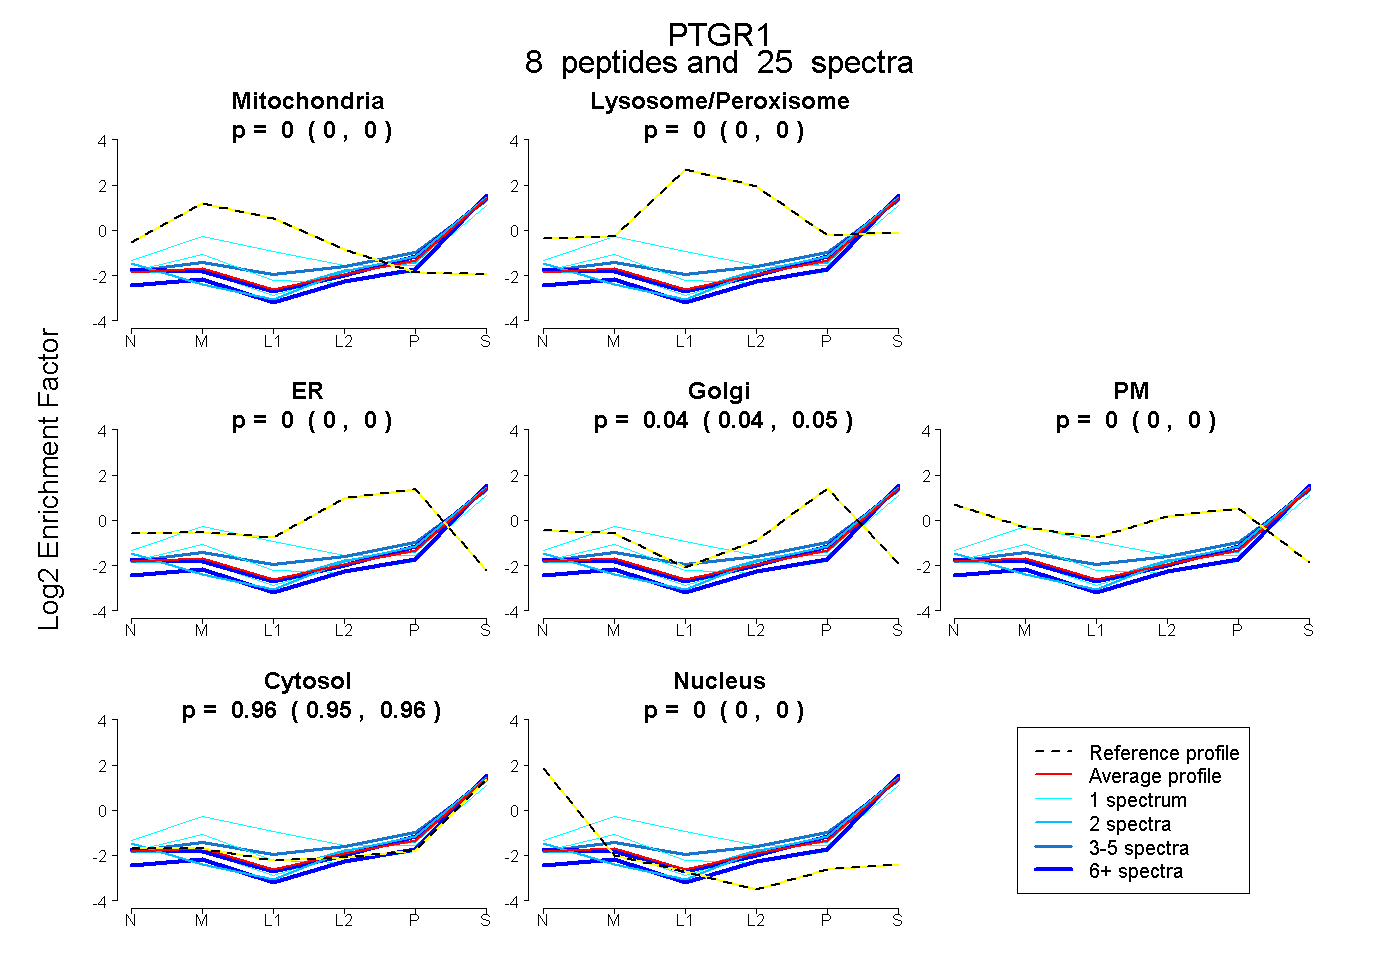
0.000 | 0.000
0.000 | 0.000
0.000 | 0.000
0.036 | 0.050
0.000 | 0.000
0.948 | 0.962
0.000 | 0.000