 15
15peptides
spectra
0.000 | 0.000
0.046 | 0.052
0.000 | 0.000
0.000 | 0.000
0.086 | 0.091
0.000 | 0.000
0.859 | 0.863
0.000 | 0.000
| Plot | Mito | Lyso | Perox | ER | Golgi | PM | Cytosol | Nucleus | |||||
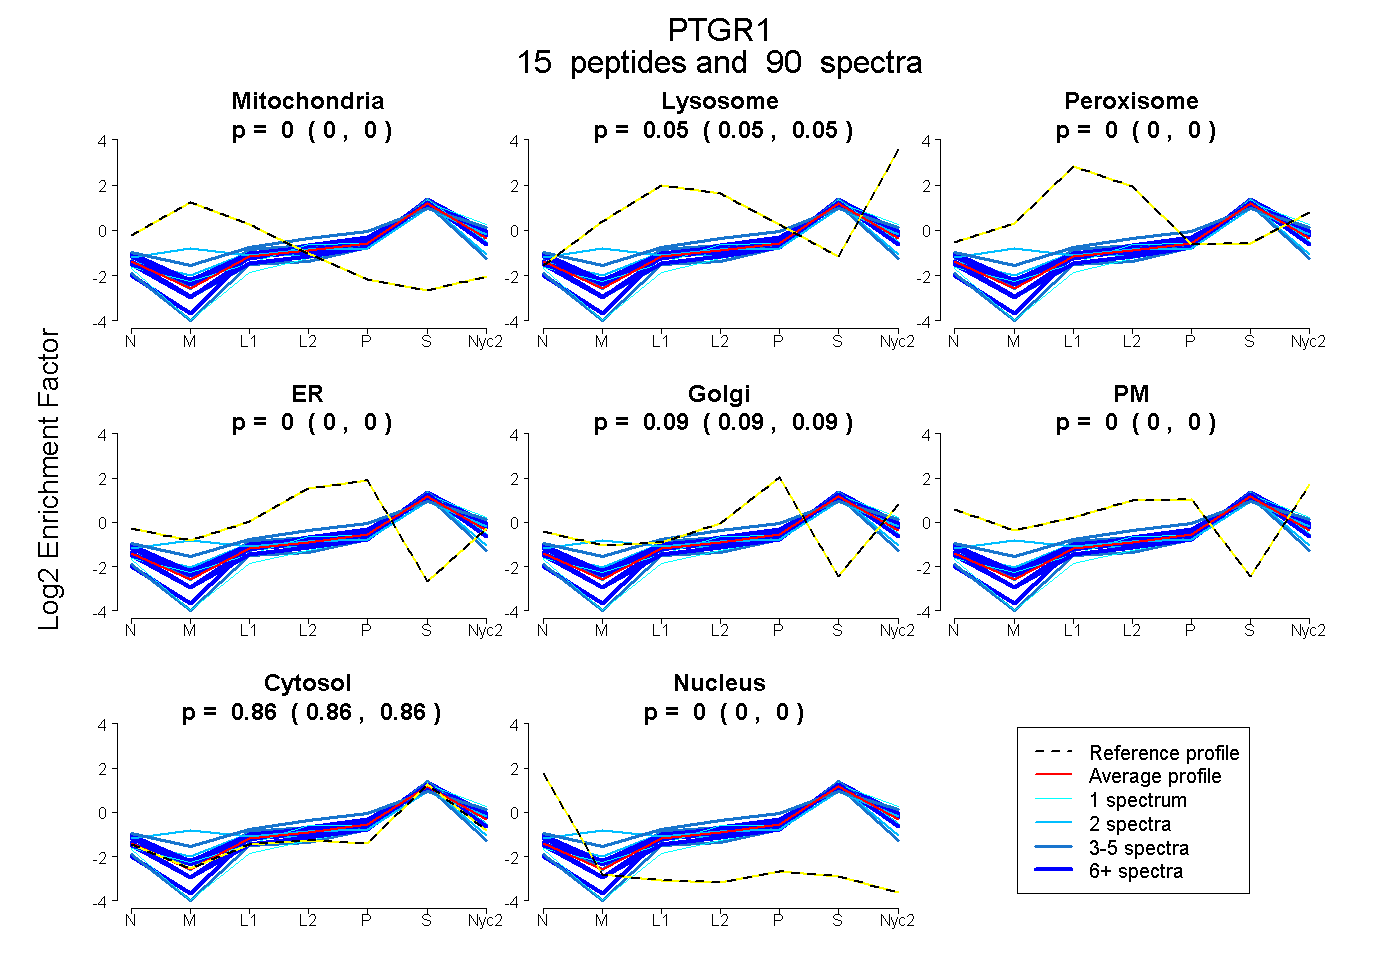
| Expt A |
15 peptides |
90 spectra |
|
0.000 0.000 | 0.000 |
0.050 0.046 | 0.052 |
0.000 0.000 | 0.000 |
0.000 0.000 | 0.000 |
0.089 0.086 | 0.091 |
0.000 0.000 | 0.000 |
0.861 0.859 | 0.863 |
0.000 0.000 | 0.000 |
| 6 spectra, MPAAFMGMLK | 0.000 | 0.044 | 0.000 | 0.000 | 0.121 | 0.000 | 0.835 | 0.000 | ||
| 11 spectra, MEGFIVTR | 0.000 | 0.086 | 0.000 | 0.000 | 0.072 | 0.000 | 0.842 | 0.000 | ||
| 5 spectra, GDNLGK | 0.000 | 0.011 | 0.042 | 0.112 | 0.000 | 0.000 | 0.834 | 0.000 | ||
| 1 spectrum, TWTLK | 0.000 | 0.131 | 0.000 | 0.000 | 0.043 | 0.000 | 0.826 | 0.000 | ||
| 12 spectra, HFEGFPTDSNFELR | 0.000 | 0.057 | 0.027 | 0.000 | 0.100 | 0.017 | 0.799 | 0.000 | ||
| 1 spectrum, VAYLK | 0.000 | 0.000 | 0.000 | 0.000 | 0.000 | 0.000 | 1.000 | 0.000 | ||
| 4 spectra, ALTDLMNWVSEGK | 0.000 | 0.000 | 0.000 | 0.000 | 0.094 | 0.000 | 0.906 | 0.000 | ||
| 3 spectra, IAICGAISQYNR | 0.000 | 0.000 | 0.000 | 0.121 | 0.000 | 0.000 | 0.879 | 0.000 | ||
| 3 spectra, LGFDVAFNYK | 0.000 | 0.000 | 0.000 | 0.000 | 0.000 | 0.000 | 1.000 | 0.000 | ||
| 21 spectra, EGDSMMGEQVAR | 0.000 | 0.050 | 0.000 | 0.000 | 0.002 | 0.000 | 0.948 | 0.000 | ||
| 4 spectra, YHEYITEGFEK | 0.000 | 0.124 | 0.065 | 0.000 | 0.159 | 0.000 | 0.653 | 0.000 | ||
| 2 spectra, WQGEVR | 0.103 | 0.161 | 0.000 | 0.000 | 0.026 | 0.000 | 0.711 | 0.000 | ||
| 6 spectra, VVGTAGSDEK | 0.000 | 0.000 | 0.000 | 0.000 | 0.065 | 0.000 | 0.935 | 0.000 | ||
| 9 spectra, SLEEALR | 0.000 | 0.057 | 0.000 | 0.000 | 0.121 | 0.000 | 0.822 | 0.000 | ||
| 2 spectra, GGETVLVNAAAGAVGSVVGQIAK | 0.018 | 0.000 | 0.047 | 0.048 | 0.000 | 0.000 | 0.887 | 0.000 |
| Plot | Mito | Lyso or Perox | ER | Golgi | PM | Cytosol | Nucleus | ||||||
| Expt B |
8 peptides |
25 spectra |
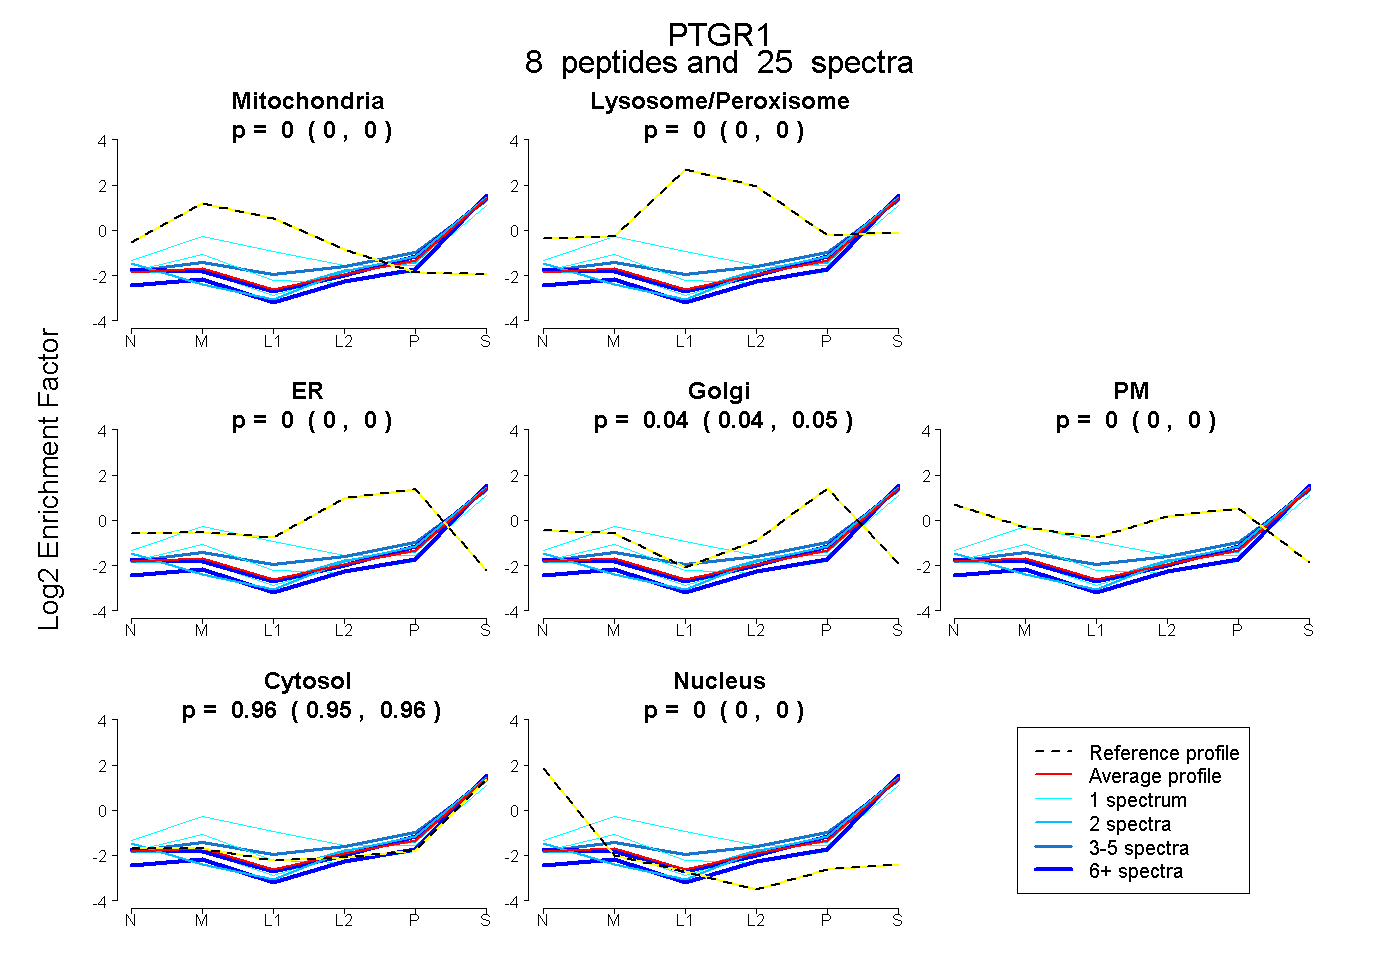 |
0.000 0.000 | 0.000 |
0.000 0.000 | 0.000 |
0.000 0.000 | 0.000 |
0.044 0.036 | 0.050 |
0.000 0.000 | 0.000 |
0.956 0.948 | 0.962 |
0.000 0.000 | 0.000 |
|||
| Plot | Lyso | Other | |||||||||||
| Expt C |
14 peptides |
96 spectra |
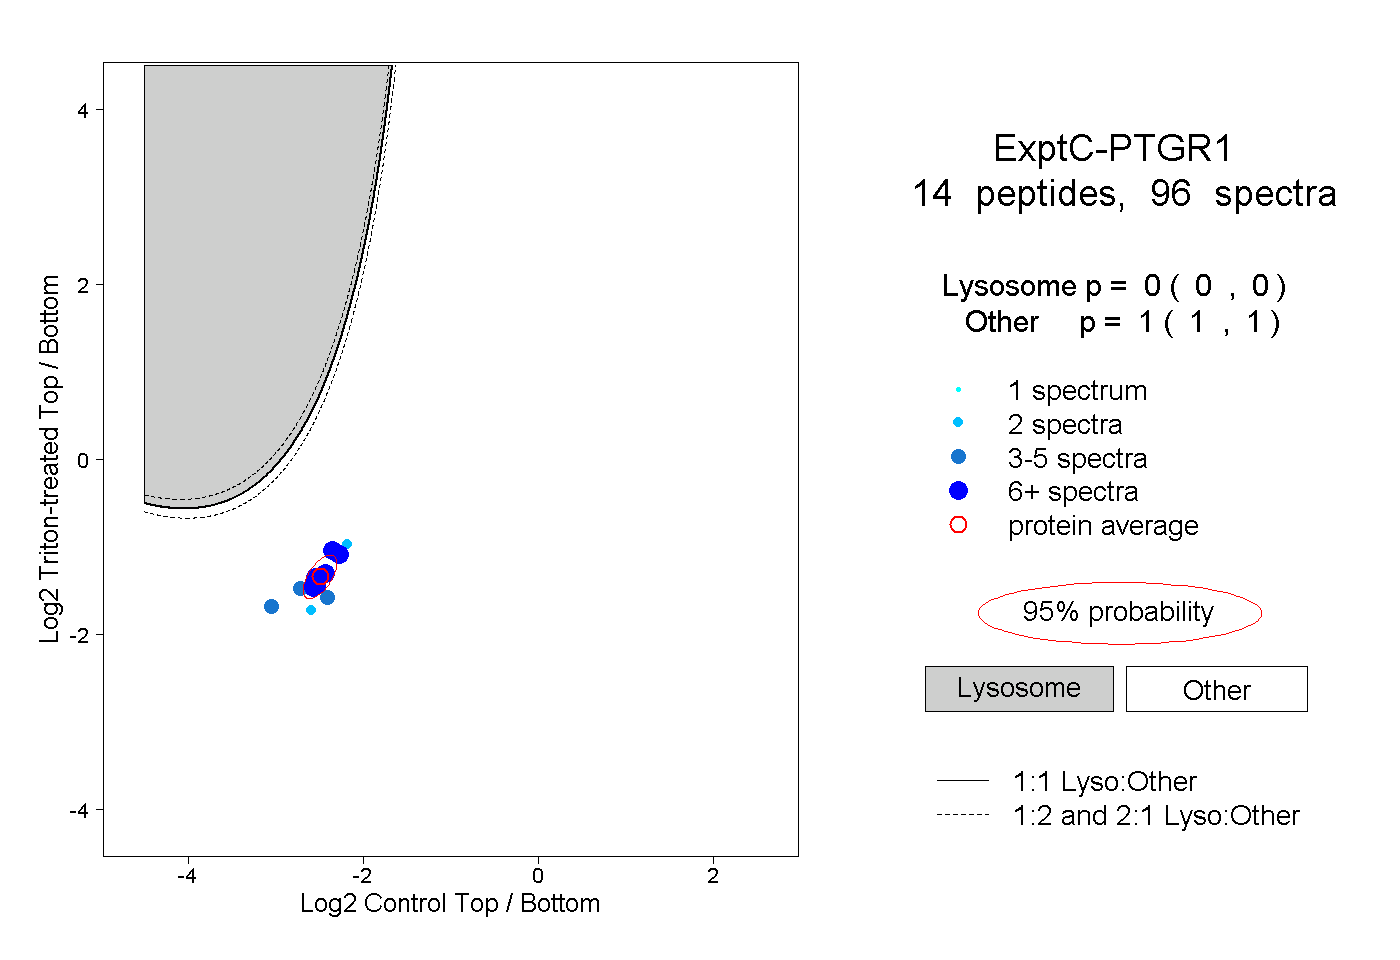 |
0.000 0.000 | 0.000 |
1.000 1.000 | 1.000 |
||||||||
| Plot | Lyso | Other | |||||||||||
| Expt D |
3 peptides |
9 spectra |
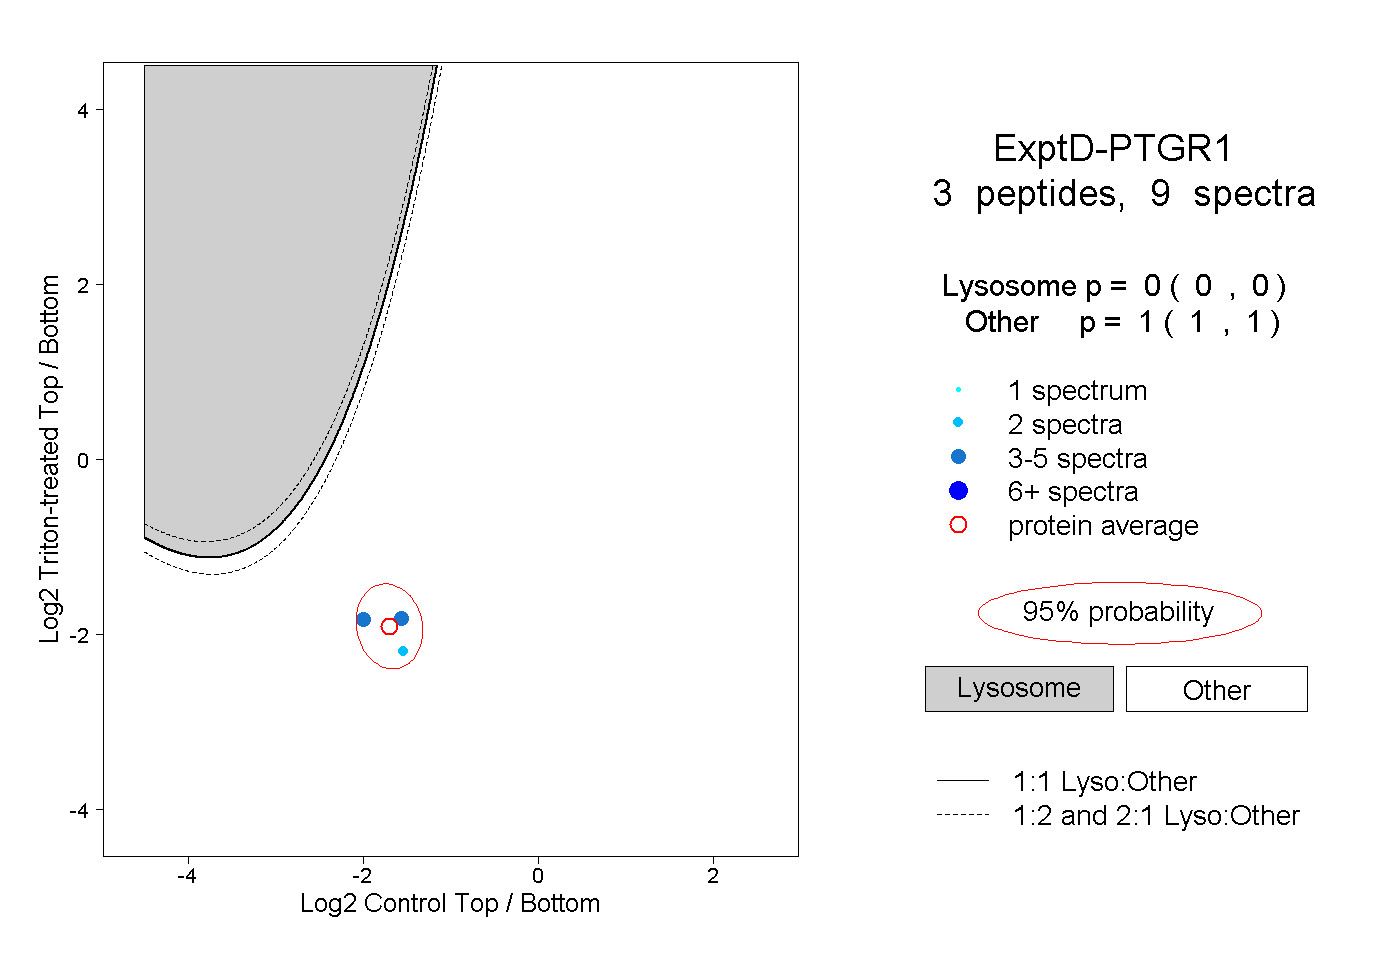 |
0.000 0.000 | 0.000 |
1.000 1.000 | 1.000 |