ACSF3
[ENSRNOP00000020313]
Main page
| | | Plot |
Mito |
Lyso |
|
Perox |
ER |
Golgi |
PM |
Cytosol |
Nucleus |
|
| Expt A |
 15
15
peptides |
36
spectra |
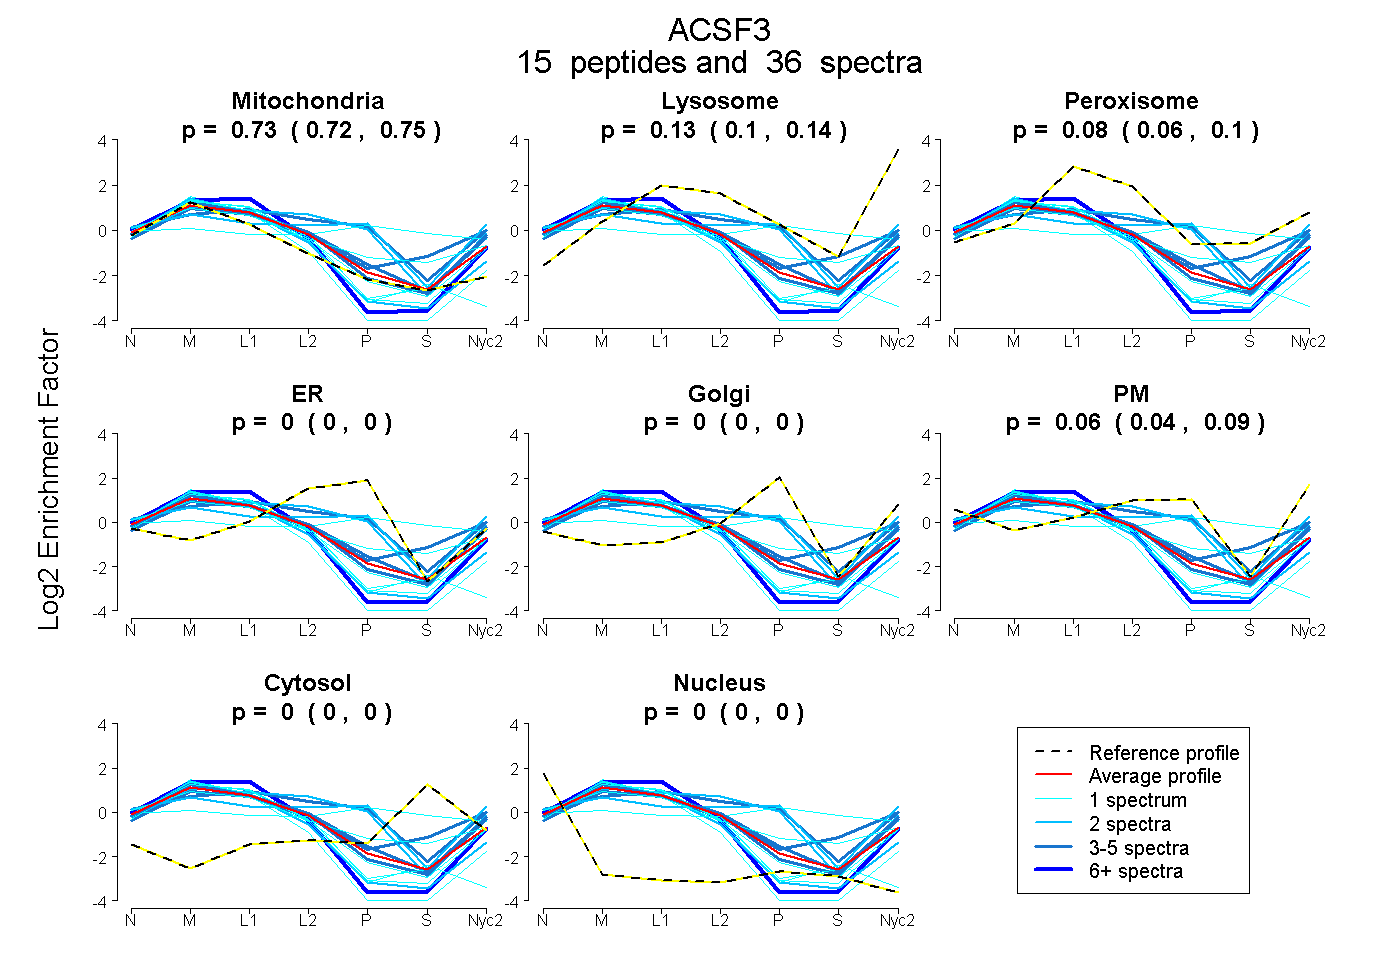 |
0.734
0.717 | 0.747 |
0.125
0.102 | 0.142 |
|
0.076
0.056 | 0.096 |
0.000
0.000 | 0.000 |
0.000
0.000 | 0.000 |
0.065
0.041 | 0.087 |
0.000
0.000 | 0.000 |
0.000
0.000 | 0.000 |
|
| | | Plot |
Mito |
|
Lyso or Perox |
|
ER |
Golgi |
PM |
Cytosol |
Nucleus |
|
| Expt B |
5
peptides |
8
spectra |
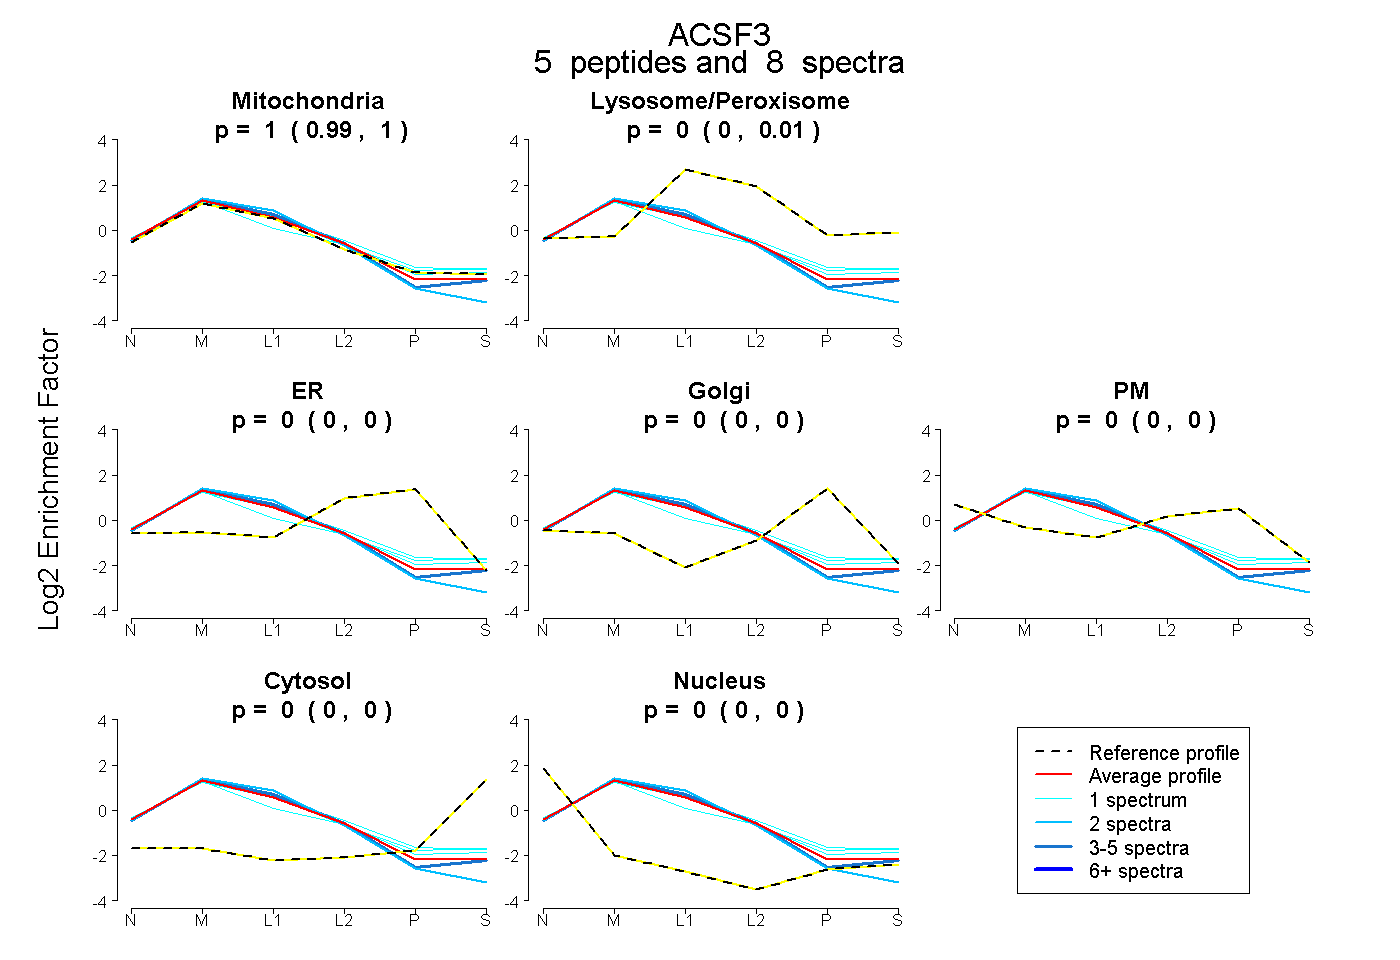 |
1.000
0.991 | 1.000 |
|
0.000
0.000 | 0.005 |
|
0.000
0.000 | 0.000 |
0.000
0.000 | 0.000 |
0.000
0.000 | 0.000 |
0.000
0.000 | 0.000 |
0.000
0.000 | 0.000 |
|
| | | Plot |
|
Lyso |
|
|
|
|
|
|
|
Other |
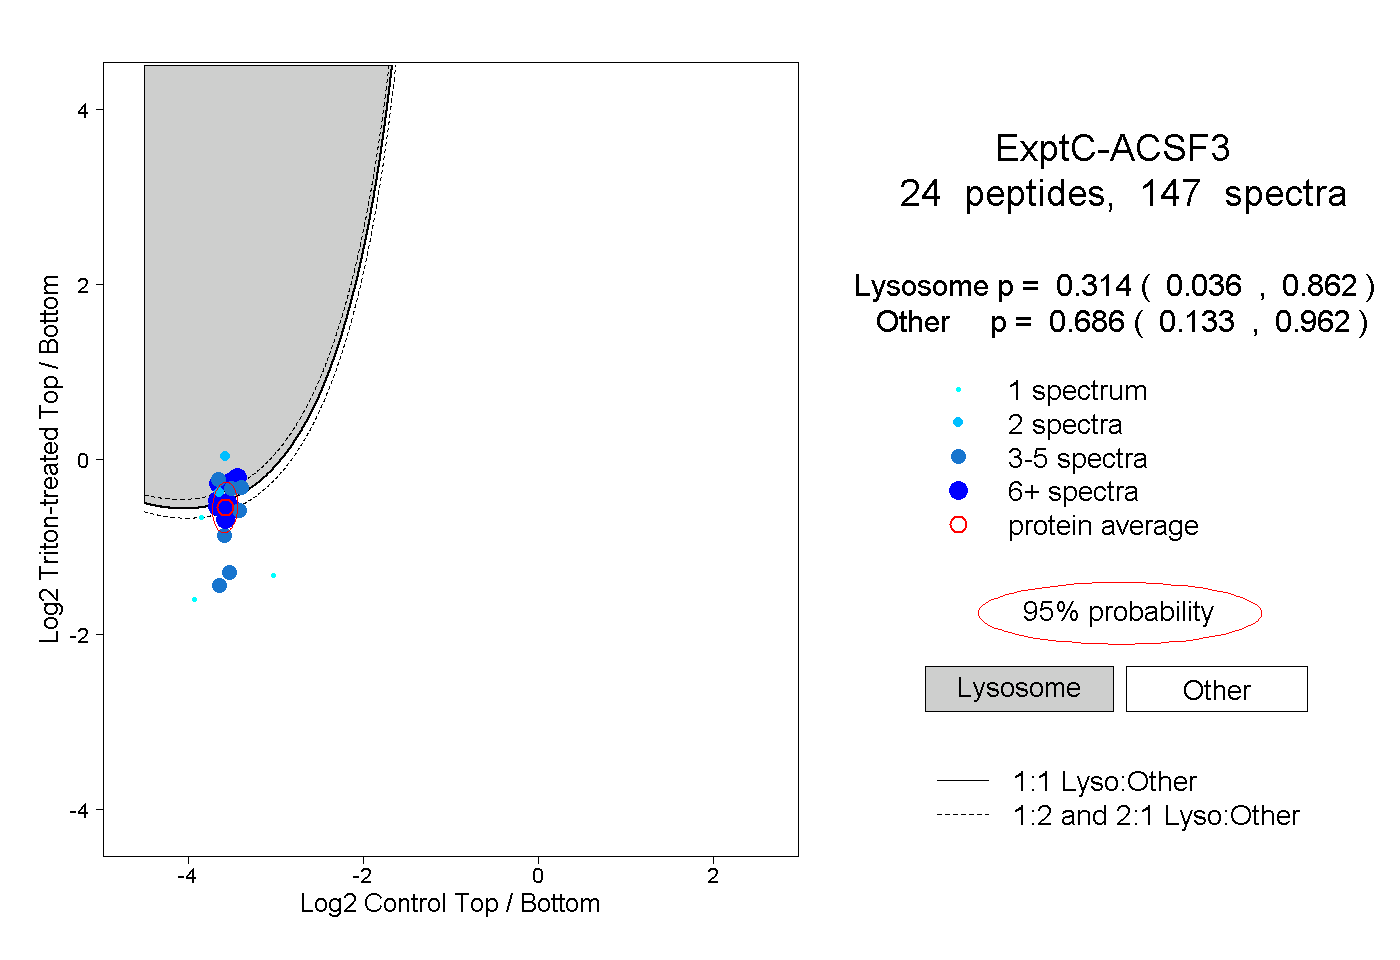
| Expt C |
24
peptides |
147
spectra |
 |
|
0.314
0.036 | 0.862 |
|
|
|
|
|
|
|
0.686
0.133 | 0.962 |
| | | Plot |
|
Lyso |
|
|
|
|
|
|
|
Other |
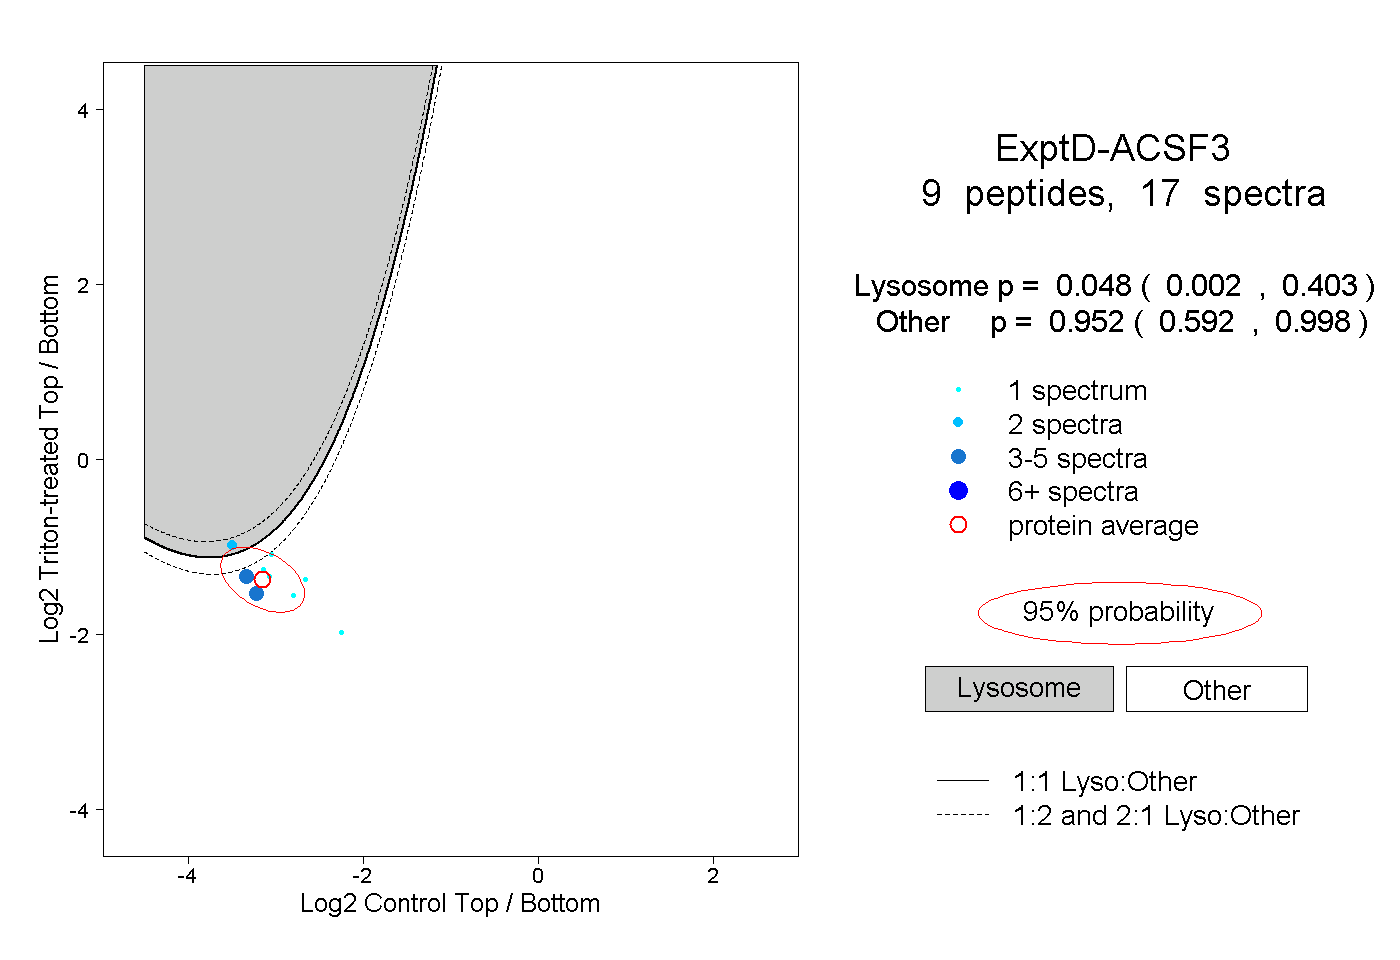
| Expt D |
9
peptides |
17
spectra |
 |
|
0.048
0.002 | 0.403 |
|
|
|
|
|
|
|
0.952
0.592 | 0.998 |
| 1 spectrum, VTPGFEEK |
|
0.168 |
|
|
|
|
|
|
|
0.832 |
| 1 spectrum, EGELLVK |
|
0.000 |
|
|
|
|
|
|
|
1.000 |
| 1 spectrum, TGDTAVFK |
|
0.092 |
|
|
|
|
|
|
|
0.908 |
| 1 spectrum, TDGSAPVFIR |
|
0.045 |
|
|
|
|
|
|
|
0.955 |
| 1 spectrum, LSPLAQR |
|
0.003 |
|
|
|
|
|
|
|
0.997 |
| 5 spectra, ALAFGDR |
|
0.107 |
|
|
|
|
|
|
|
0.893 |
| 1 spectrum, QLLQQFYPSEQR |
|
0.003 |
|
|
|
|
|
|
|
0.997 |
| 4 spectra, VGDLQEER |
|
0.024 |
|
|
|
|
|
|
|
0.976 |
| 2 spectra, LLDYYDR |
|
0.669 |
|
|
|
|
|
|
|
0.331 |