15
15peptides
spectra
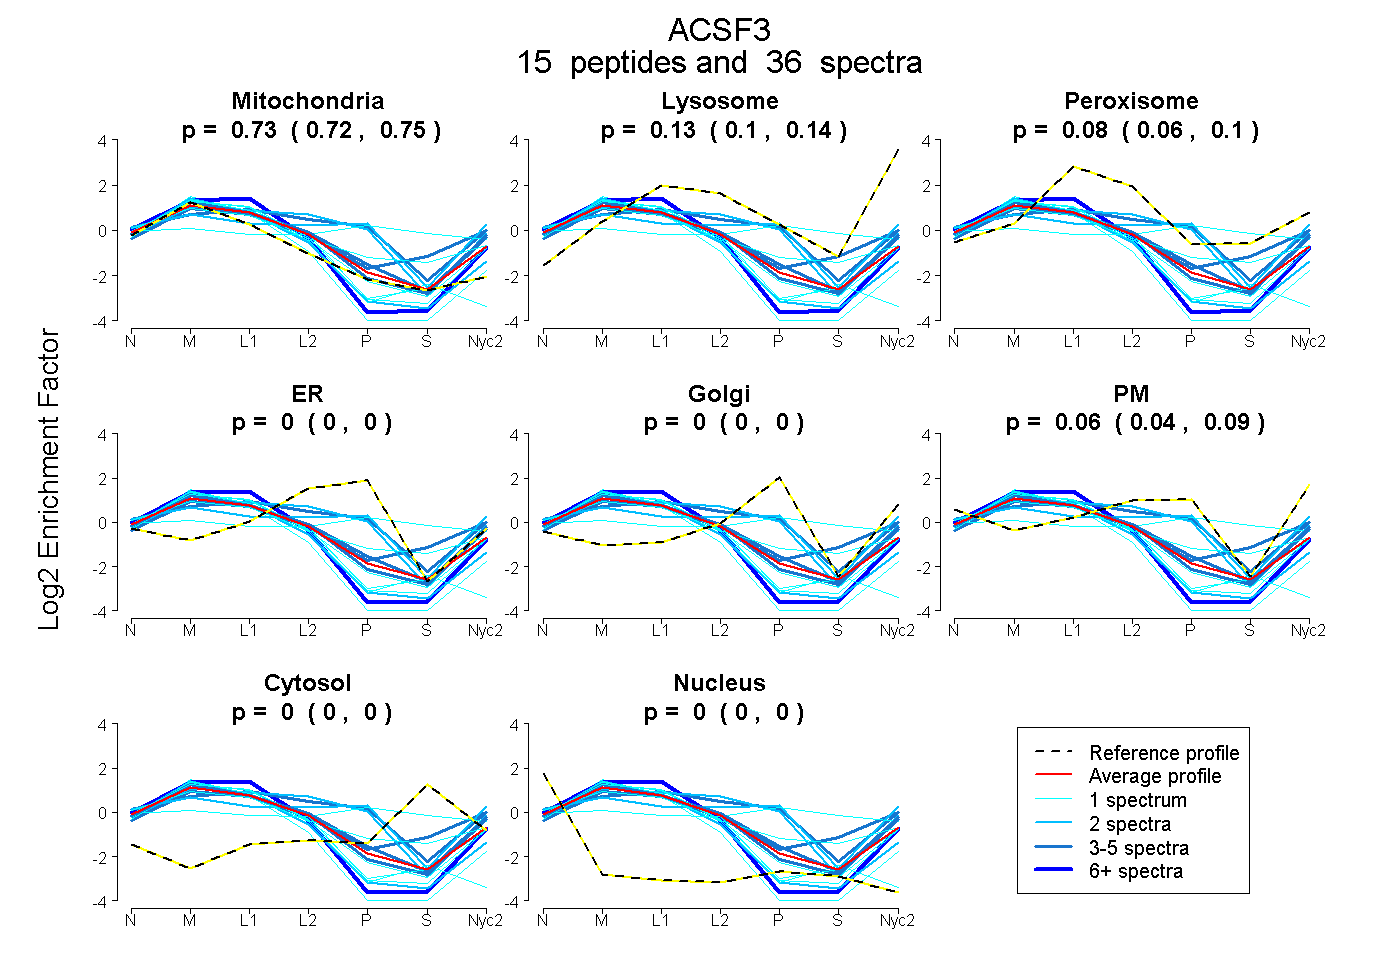
0.717 | 0.747
0.102 | 0.142
0.056 | 0.096
0.000 | 0.000
0.000 | 0.000
0.041 | 0.087
0.000 | 0.000
0.000 | 0.000
5peptides
spectra
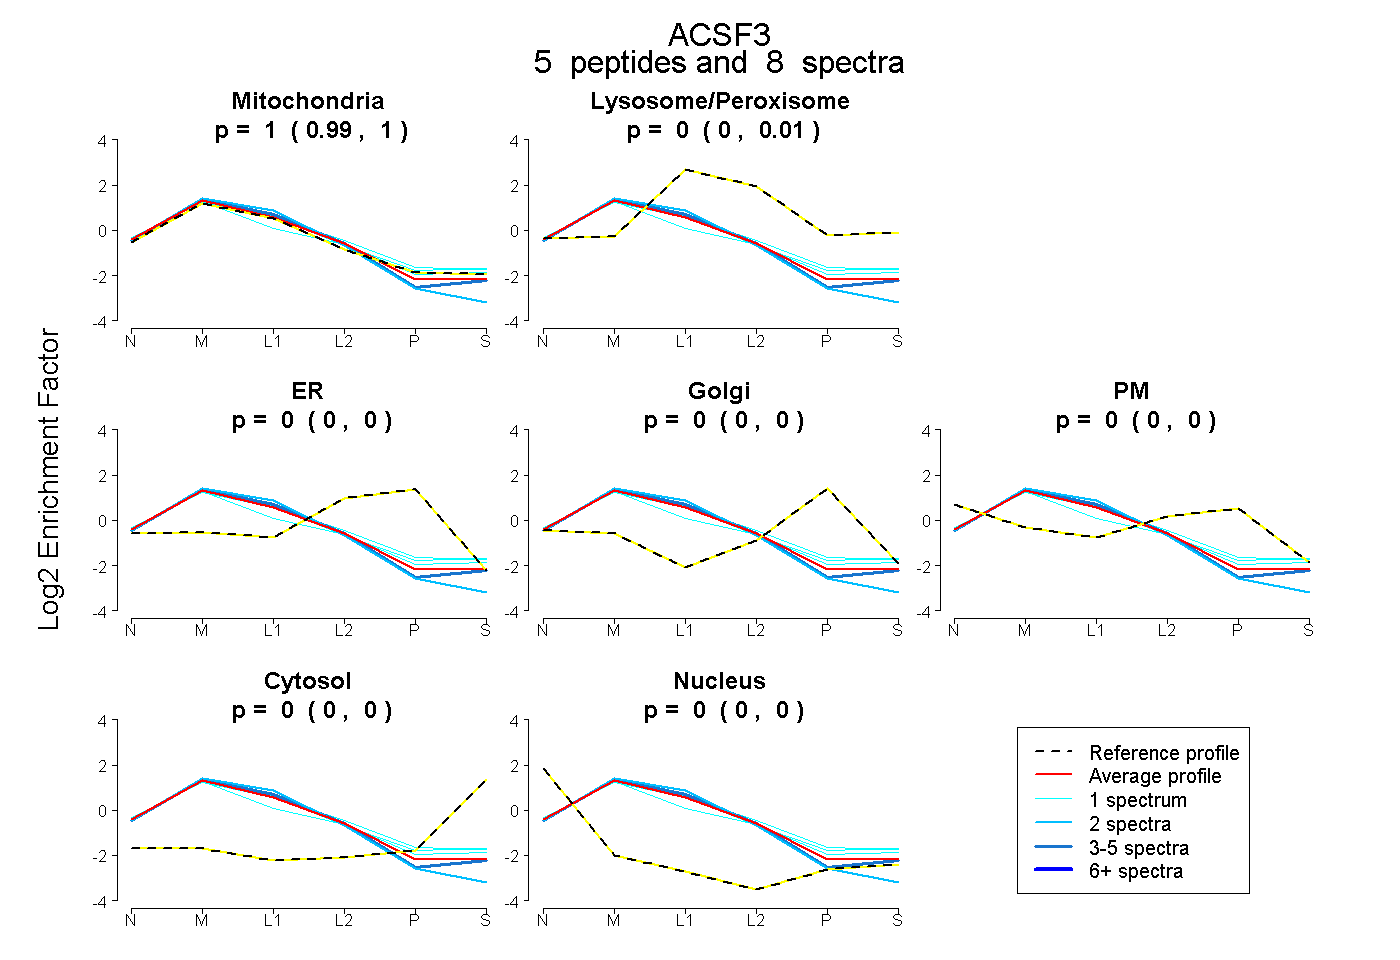
0.991 | 1.000
0.000 | 0.005
0.000 | 0.000
0.000 | 0.000
0.000 | 0.000
0.000 | 0.000
0.000 | 0.000