 15
15peptides
spectra
0.717 | 0.747
0.102 | 0.142
0.056 | 0.096
0.000 | 0.000
0.000 | 0.000
0.041 | 0.087
0.000 | 0.000
0.000 | 0.000
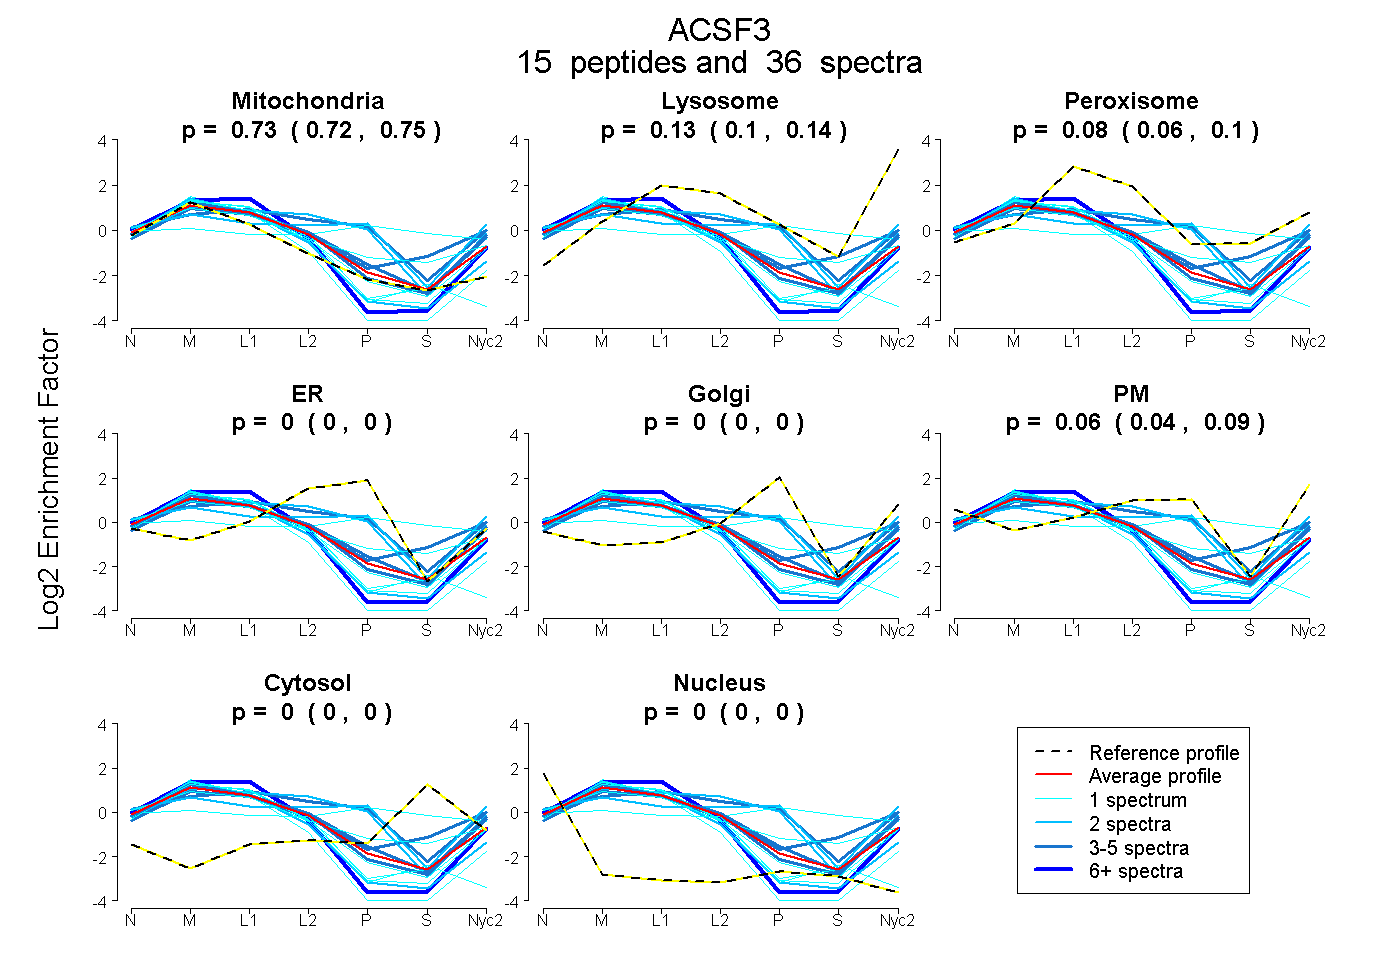
| Plot | Mito | Lyso | Perox | ER | Golgi | PM | Cytosol | Nucleus | |||||
| Expt A |
15 peptides |
36 spectra |
|
0.734 0.717 | 0.747 |
0.125 0.102 | 0.142 |
0.076 0.056 | 0.096 |
0.000 0.000 | 0.000 |
0.000 0.000 | 0.000 |
0.065 0.041 | 0.087 |
0.000 0.000 | 0.000 |
0.000 0.000 | 0.000 |
| 1 spectrum, VTPGFEEK | 0.559 | 0.000 | 0.231 | 0.000 | 0.000 | 0.133 | 0.077 | 0.000 | ||
| 1 spectrum, VSALEIER | 0.801 | 0.063 | 0.135 | 0.000 | 0.000 | 0.000 | 0.000 | 0.000 | ||
| 3 spectra, ALAFGDR | 0.537 | 0.219 | 0.131 | 0.000 | 0.000 | 0.000 | 0.112 | 0.000 | ||
| 8 spectra, GAMIFYTSGTTGRPK | 0.875 | 0.066 | 0.059 | 0.000 | 0.000 | 0.000 | 0.000 | 0.000 | ||
| 1 spectrum, LLDYYDR | 0.816 | 0.164 | 0.020 | 0.000 | 0.000 | 0.000 | 0.000 | 0.000 | ||
| 1 spectrum, TSVDIIK | 0.865 | 0.135 | 0.000 | 0.000 | 0.000 | 0.000 | 0.000 | 0.000 | ||
| 1 spectrum, EGELLVK | 1.000 | 0.000 | 0.000 | 0.000 | 0.000 | 0.000 | 0.000 | 0.000 | ||
| 1 spectrum, SSVVVVGQEYLER | 0.182 | 0.000 | 0.237 | 0.000 | 0.278 | 0.020 | 0.282 | 0.000 | ||
| 5 spectra, TDGSAPVFIR | 0.753 | 0.247 | 0.000 | 0.000 | 0.000 | 0.000 | 0.000 | 0.000 | ||
| 4 spectra, HFTQSHVQDFVR | 0.318 | 0.000 | 0.196 | 0.127 | 0.000 | 0.358 | 0.000 | 0.000 | ||
| 2 spectra, QLLQQFYPSEQR | 0.354 | 0.043 | 0.000 | 0.079 | 0.037 | 0.486 | 0.000 | 0.000 | ||
| 2 spectra, HPEAQLEYFIQDSR | 0.412 | 0.166 | 0.029 | 0.292 | 0.000 | 0.100 | 0.000 | 0.000 | ||
| 3 spectra, VGDLQEER | 0.680 | 0.218 | 0.000 | 0.000 | 0.000 | 0.102 | 0.000 | 0.000 | ||
| 2 spectra, SAFTPDGWFR | 0.958 | 0.042 | 0.000 | 0.000 | 0.000 | 0.000 | 0.000 | 0.000 | ||
| 1 spectrum, SLCLAQEICSLR | 1.000 | 0.000 | 0.000 | 0.000 | 0.000 | 0.000 | 0.000 | 0.000 |
| Plot | Mito | Lyso or Perox | ER | Golgi | PM | Cytosol | Nucleus | ||||||
| Expt B |
5 peptides |
8 spectra |
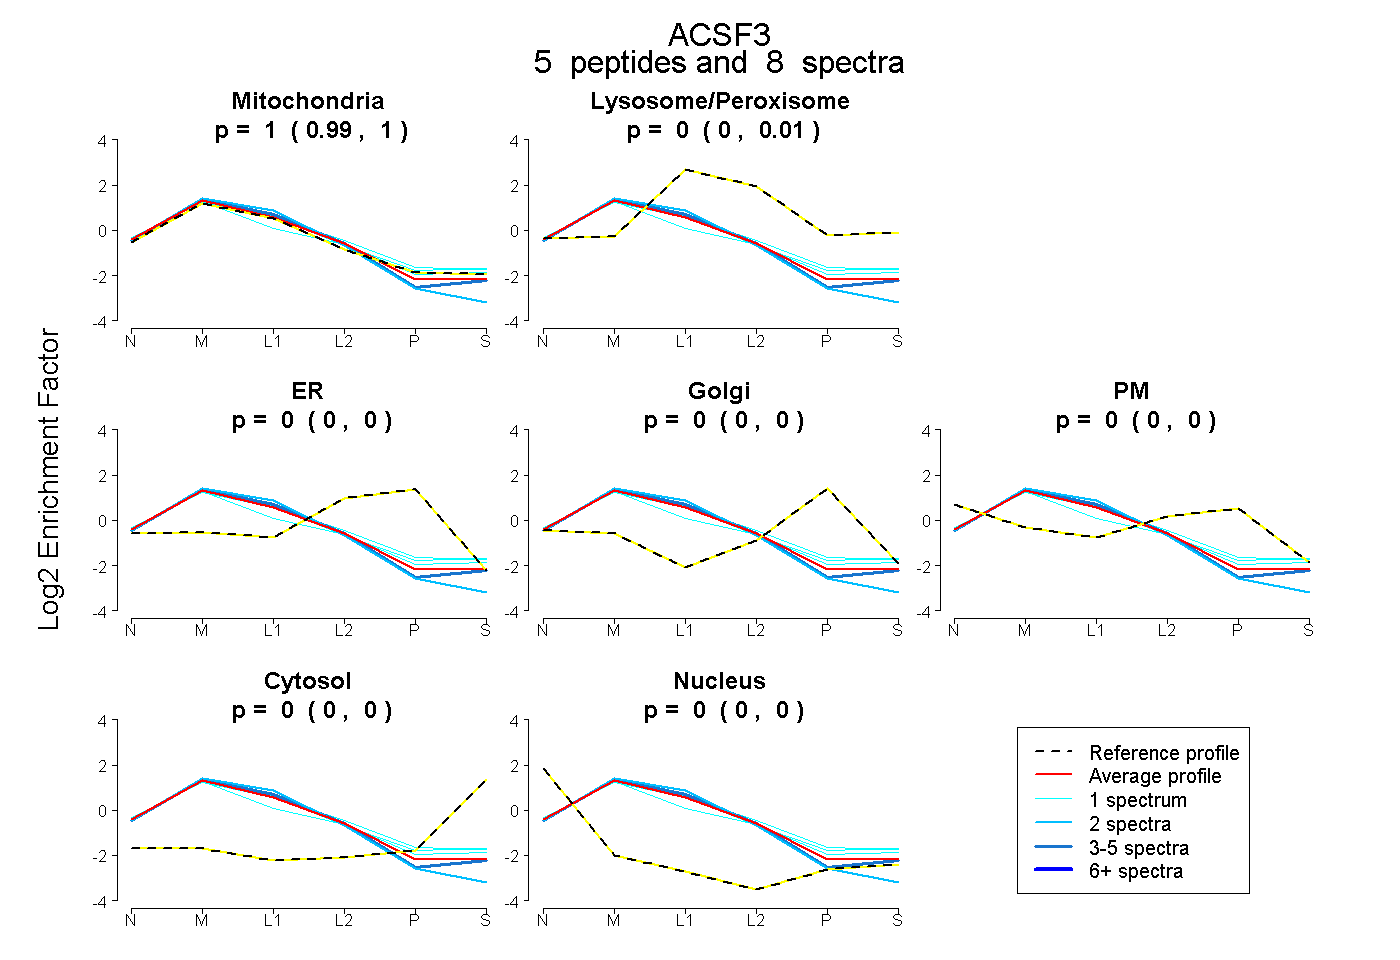 |
1.000 0.991 | 1.000 |
0.000 0.000 | 0.005 |
0.000 0.000 | 0.000 |
0.000 0.000 | 0.000 |
0.000 0.000 | 0.000 |
0.000 0.000 | 0.000 |
0.000 0.000 | 0.000 |
|||
| Plot | Lyso | Other | |||||||||||
| Expt C |
24 peptides |
147 spectra |
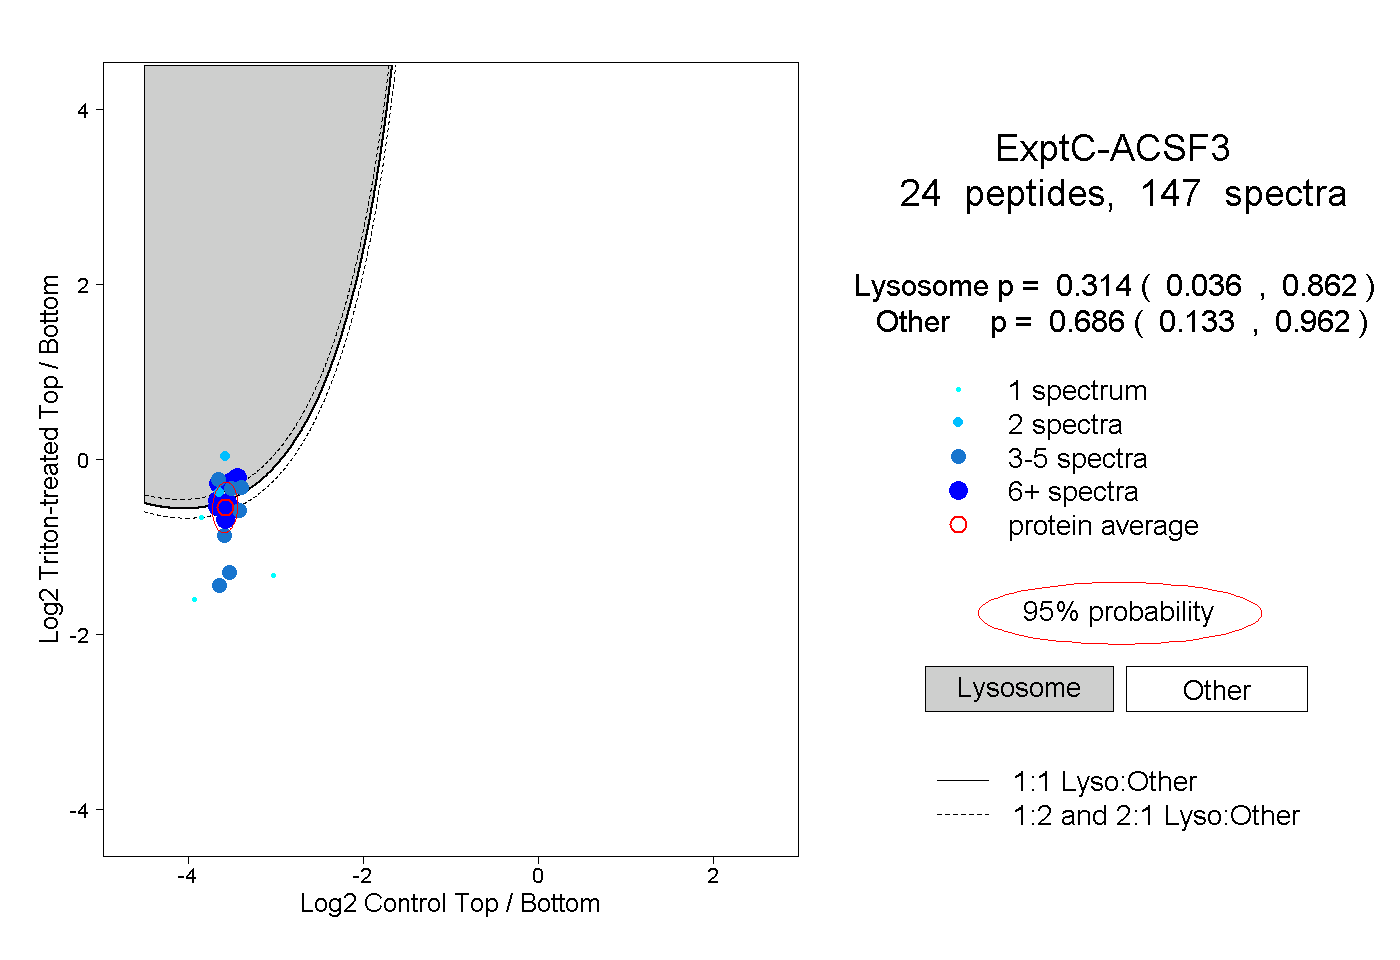 |
0.314 0.036 | 0.862 |
0.686 0.133 | 0.962 |
||||||||
| Plot | Lyso | Other | |||||||||||
| Expt D |
9 peptides |
17 spectra |
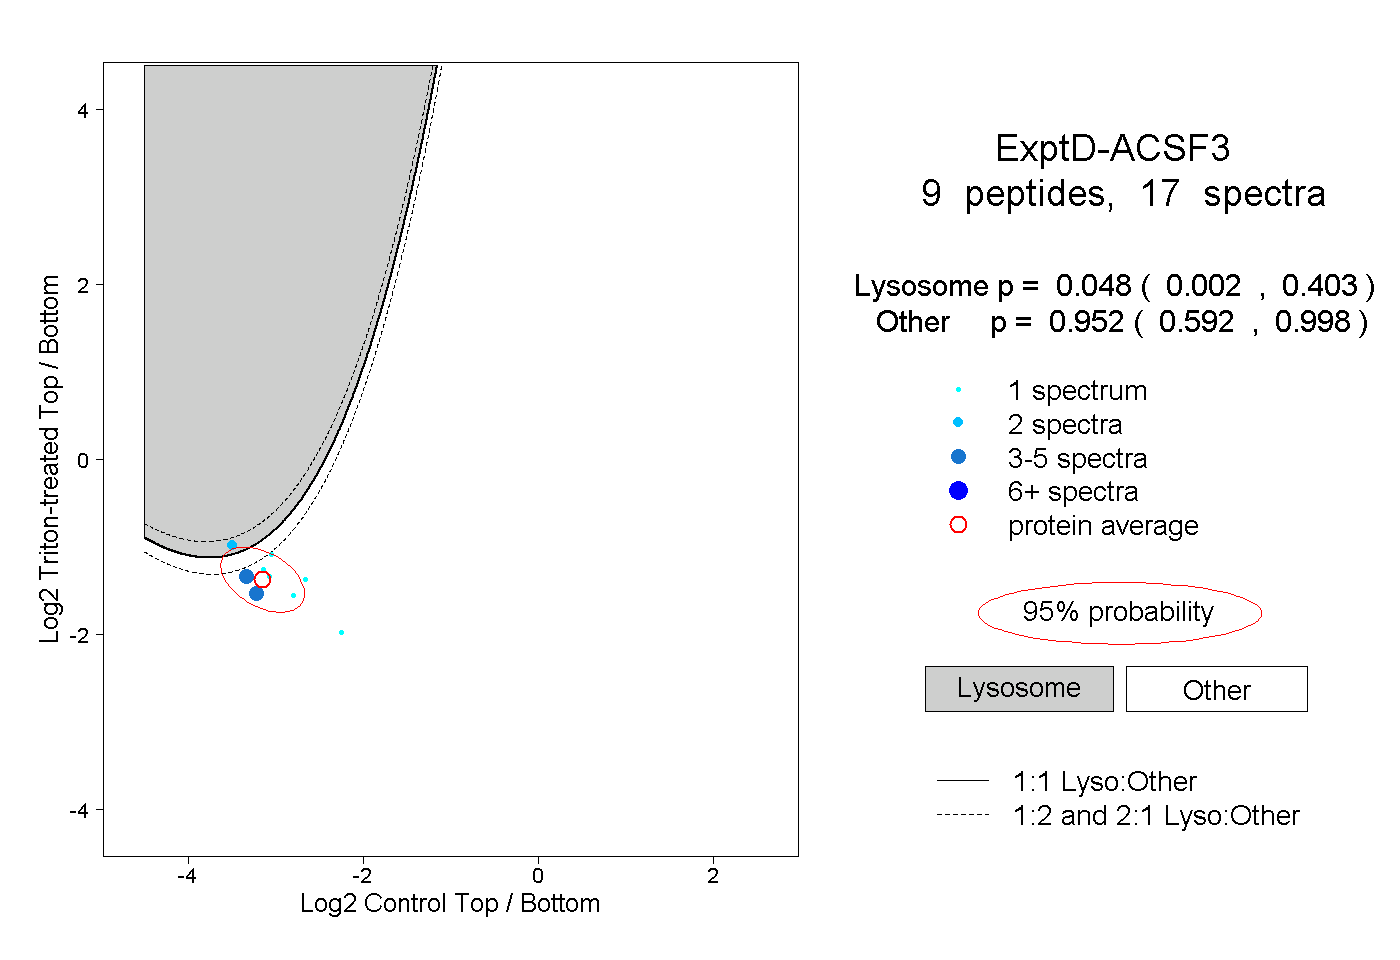 |
0.048 0.002 | 0.403 |
0.952 0.592 | 0.998 |