 3
3peptides
spectra
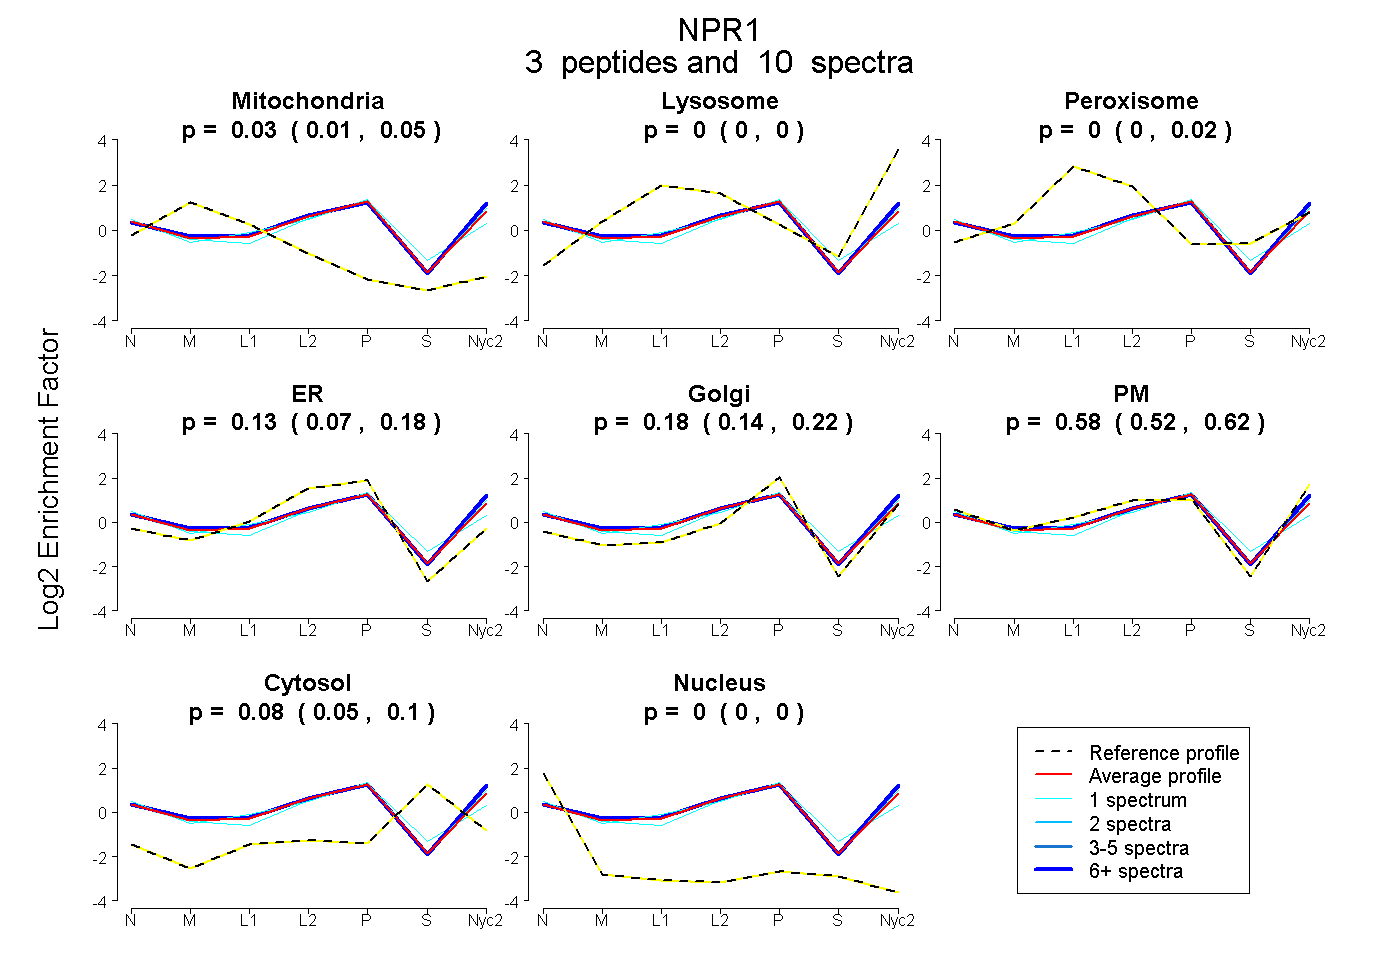
0.007 | 0.047
0.000 | 0.000
0.000 | 0.018
0.068 | 0.176
0.137 | 0.223
0.520 | 0.624
0.055 | 0.100
0.000 | 0.000
4peptides
spectra
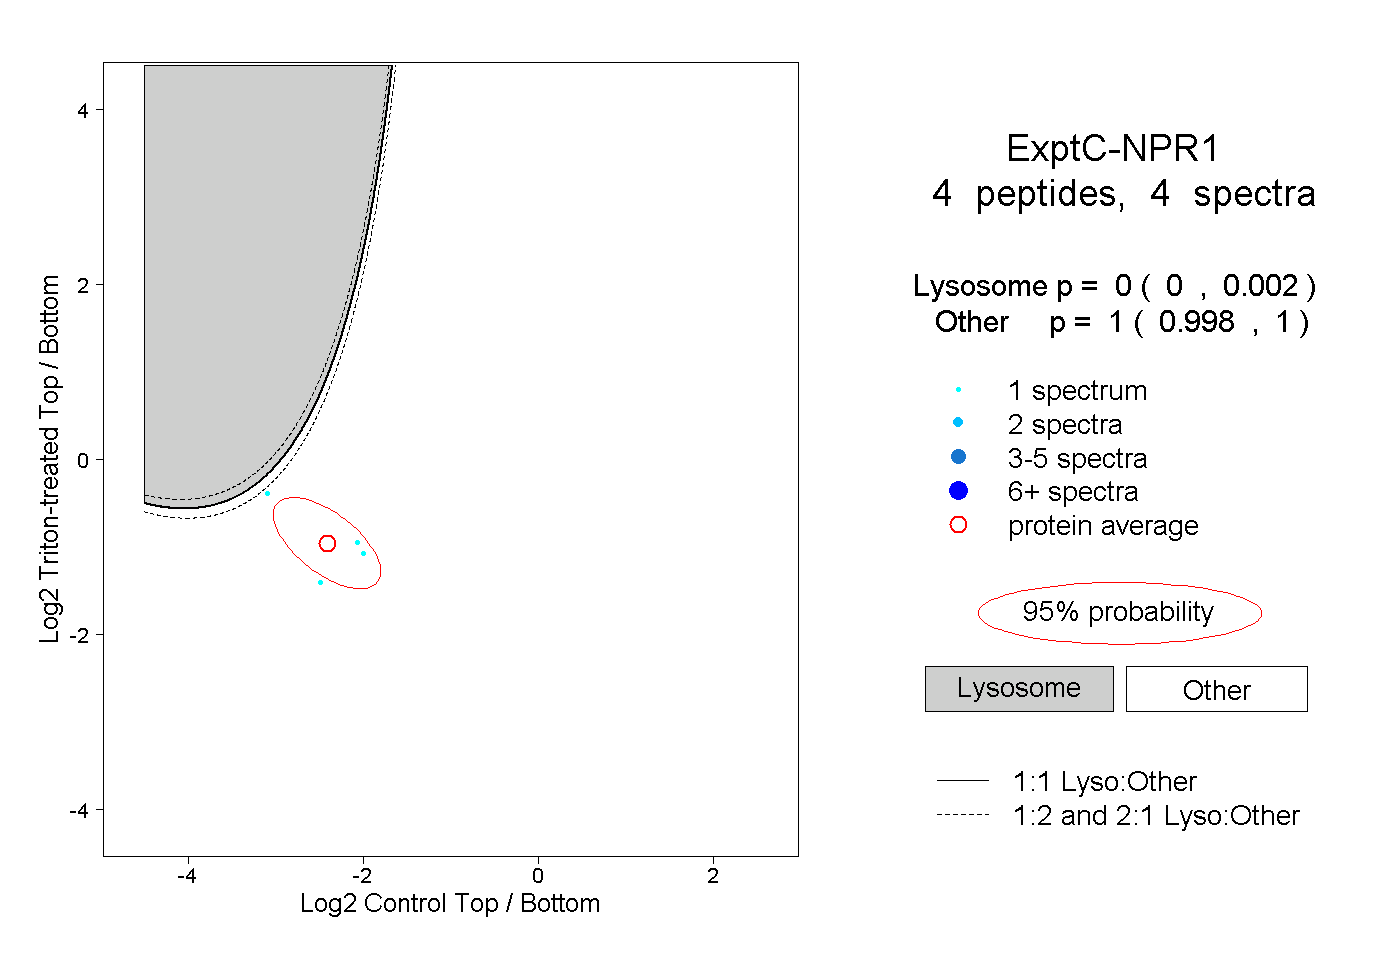
0.000 | 0.002
0.998 | 1.000
| Plot | Mito | Lyso | Perox | ER | Golgi | PM | Cytosol | Nucleus | |||||
| Expt A |
3 peptides |
10 spectra |
|
0.030 0.007 | 0.047 |
0.000 0.000 | 0.000 |
0.000 0.000 | 0.018 |
0.128 0.068 | 0.176 |
0.179 0.137 | 0.223 |
0.582 0.520 | 0.624 |
0.080 0.055 | 0.100 |
0.000 0.000 | 0.000 |
||
| Plot | Lyso | Other | |||||||||||
| Expt C |
4 peptides |
4 spectra |
|
0.000 0.000 | 0.002 |
1.000 0.998 | 1.000 |