 4
4peptides
spectra
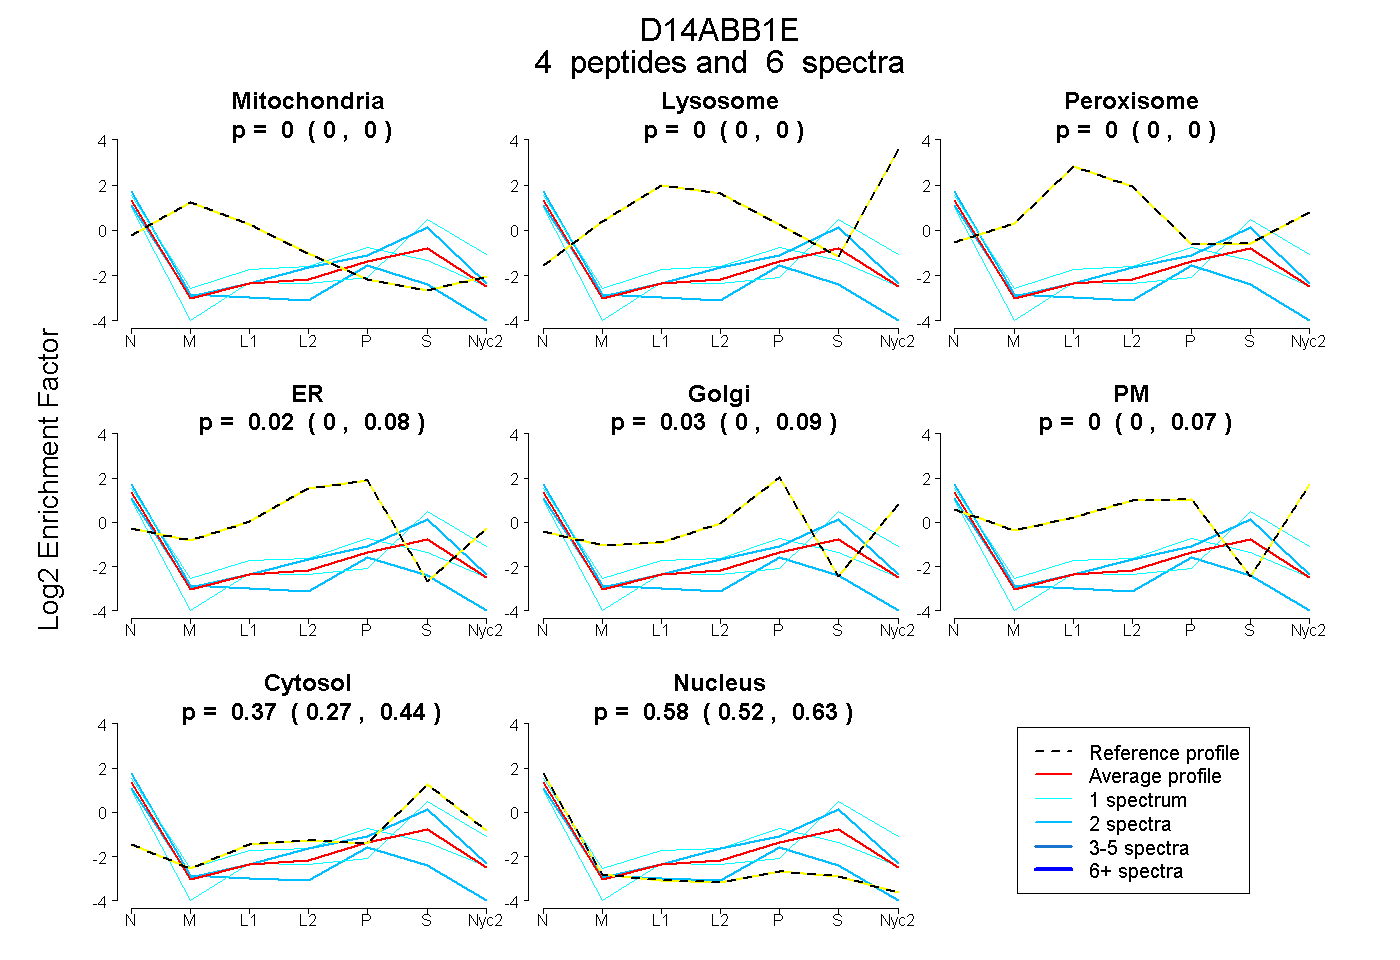
0.000 | 0.000
0.000 | 0.000
0.000 | 0.000
0.000 | 0.077
0.000 | 0.090
0.000 | 0.070
0.267 | 0.438
0.517 | 0.629
| Plot | Mito | Lyso | Perox | ER | Golgi | PM | Cytosol | Nucleus | |||||
| Expt A |
4 peptides |
6 spectra |
|
0.000 0.000 | 0.000 |
0.000 0.000 | 0.000 |
0.000 0.000 | 0.000 |
0.022 0.000 | 0.077 |
0.035 0.000 | 0.090 |
0.000 0.000 | 0.070 |
0.366 0.267 | 0.438 |
0.577 0.517 | 0.629 |
| 1 spectrum, IENVHFK | 0.000 | 0.000 | 0.000 | 0.000 | 0.000 | 0.000 | 0.620 | 0.380 | ||
| 1 spectrum, GAEEPERPFR | 0.000 | 0.000 | 0.000 | 0.248 | 0.000 | 0.000 | 0.204 | 0.548 | ||
| 2 spectra, LVLVKPLGDR | 0.000 | 0.000 | 0.000 | 0.043 | 0.000 | 0.000 | 0.524 | 0.432 | ||
| 2 spectra, ALFQQLTPGSR | 0.000 | 0.000 | 0.000 | 0.050 | 0.002 | 0.000 | 0.017 | 0.930 |