 12
12peptides
spectra
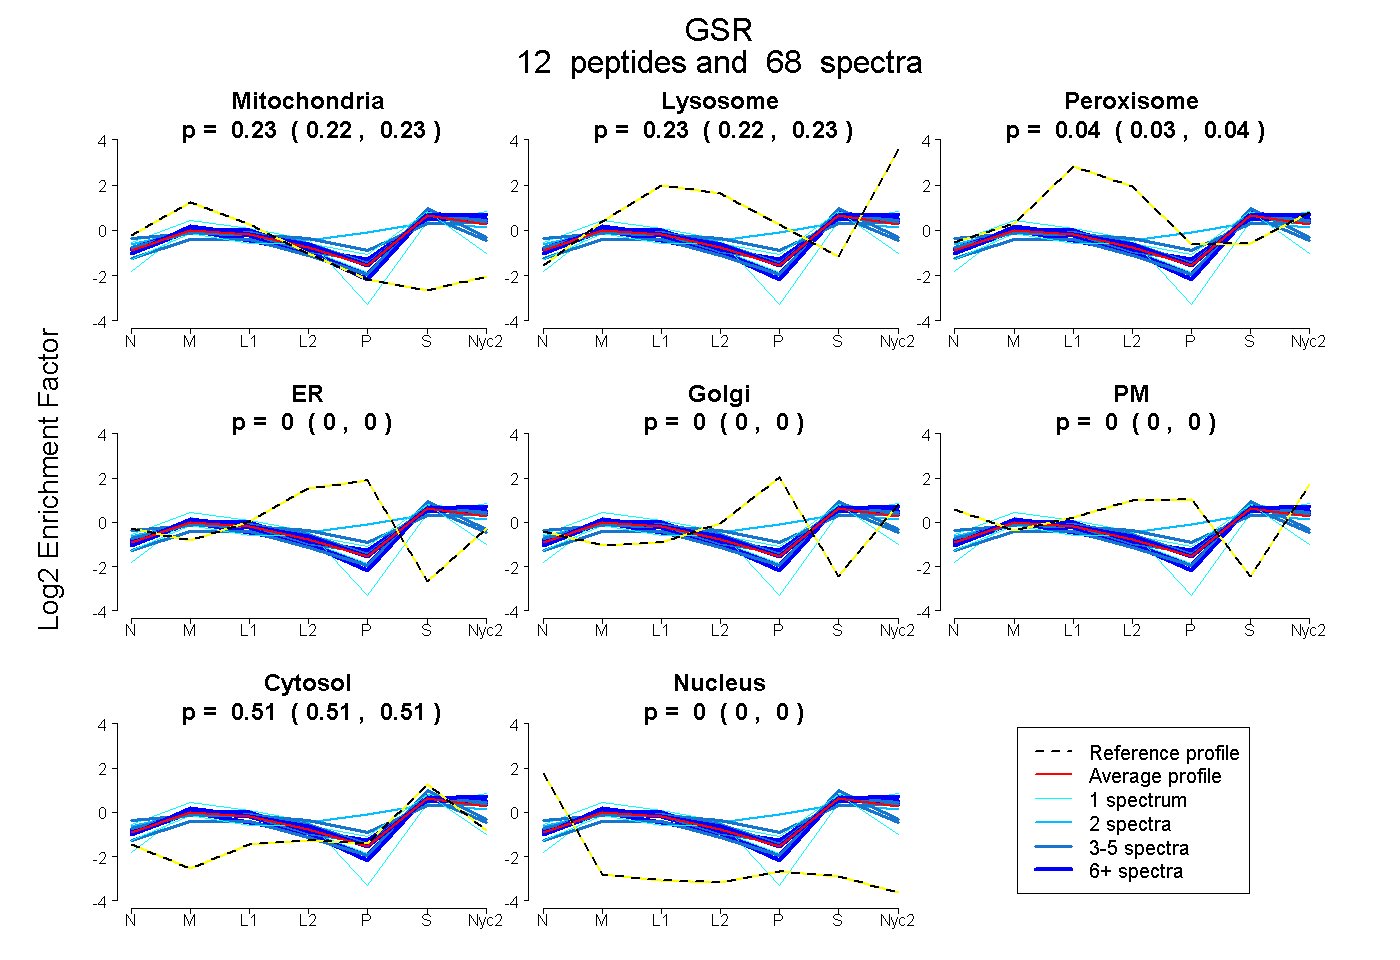
0.225 | 0.232
0.217 | 0.233
0.029 | 0.044
0.000 | 0.000
0.000 | 0.000
0.000 | 0.000
0.506 | 0.510
0.000 | 0.000
6peptides
spectra
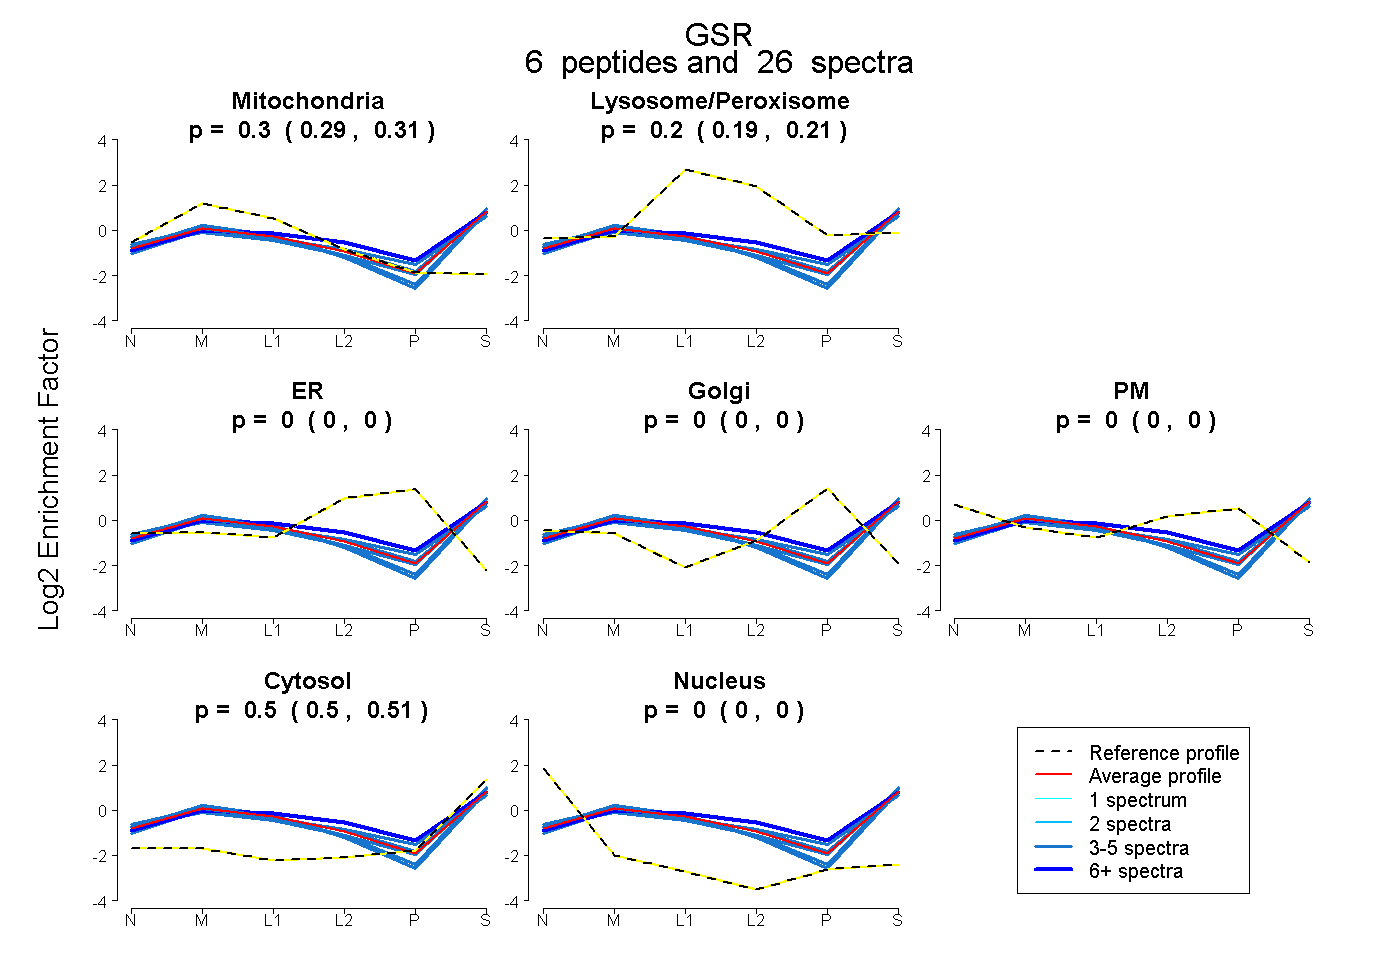
0.290 | 0.308
0.189 | 0.206
0.000 | 0.000
0.000 | 0.000
0.000 | 0.000
0.498 | 0.506
0.000 | 0.000
15peptides
spectra
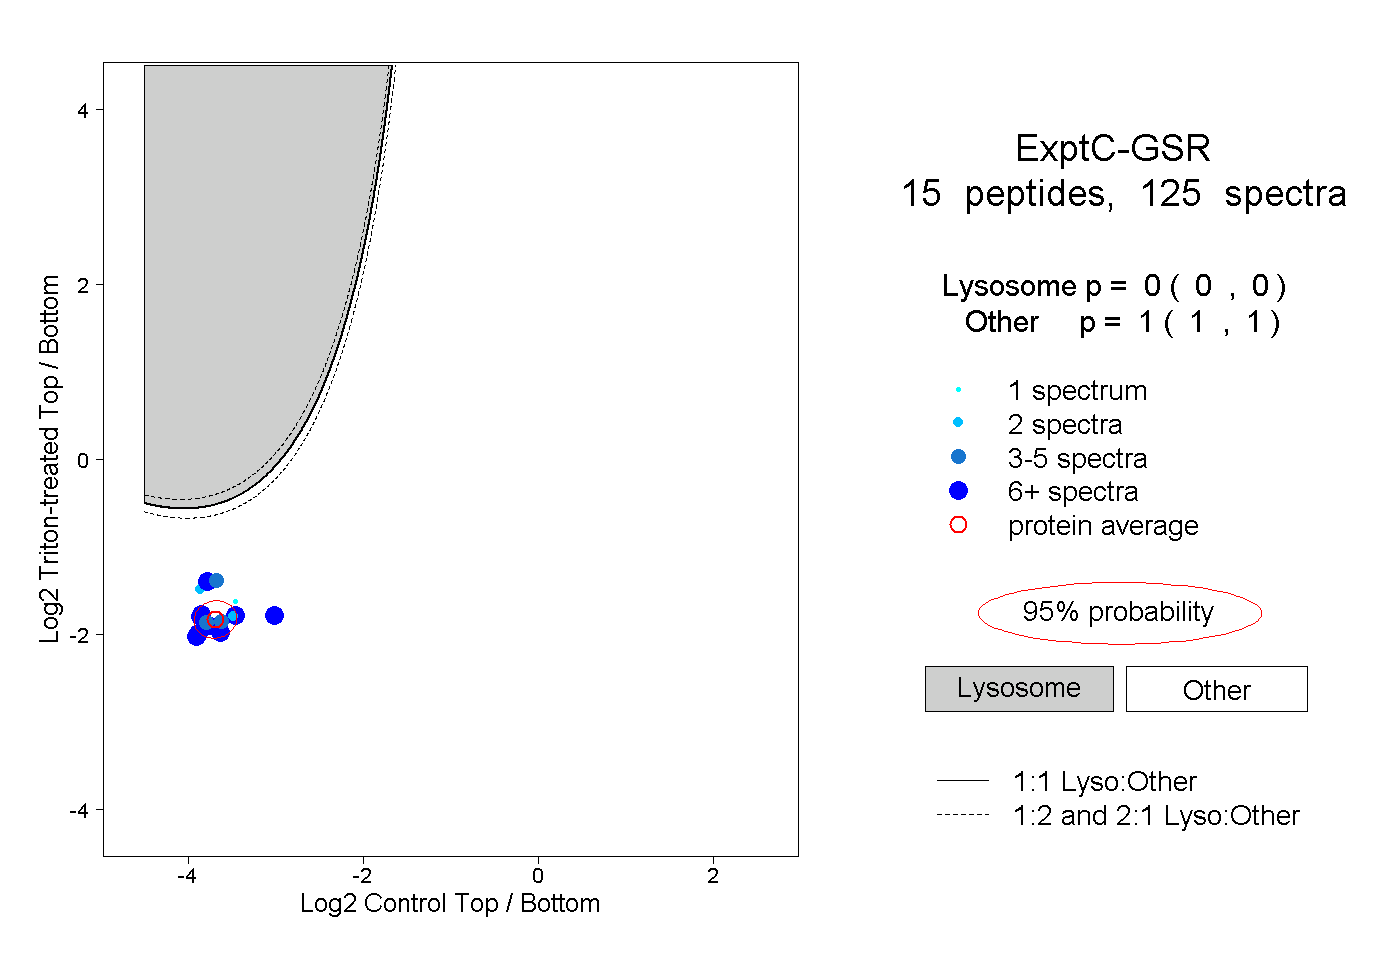
0.000 | 0.000
1.000 | 1.000
4peptides
spectra
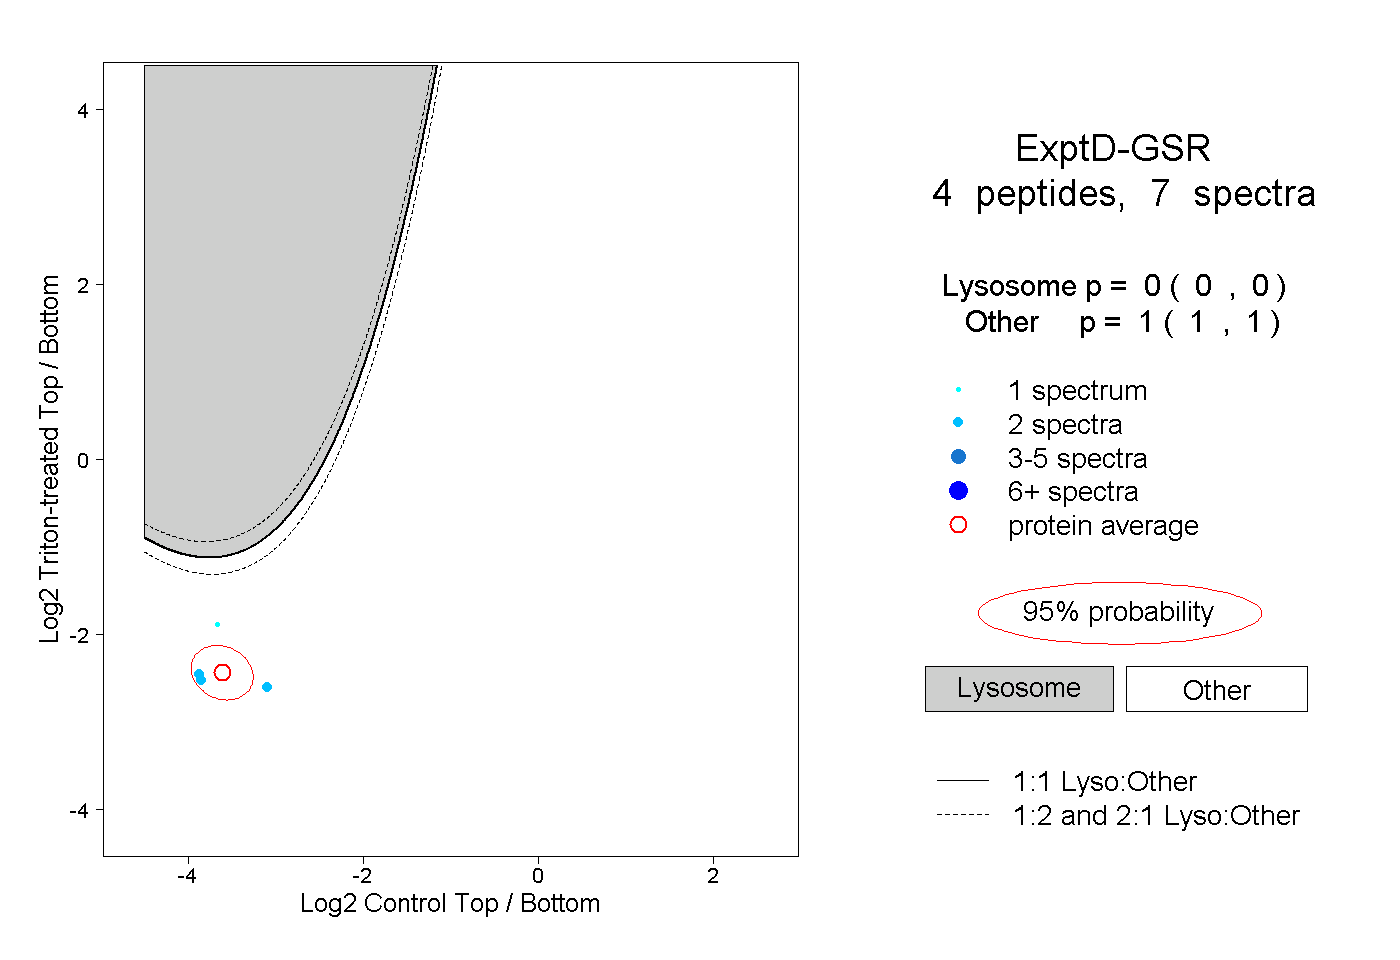
0.000 | 0.000
1.000 | 1.000