12
12peptides
spectra
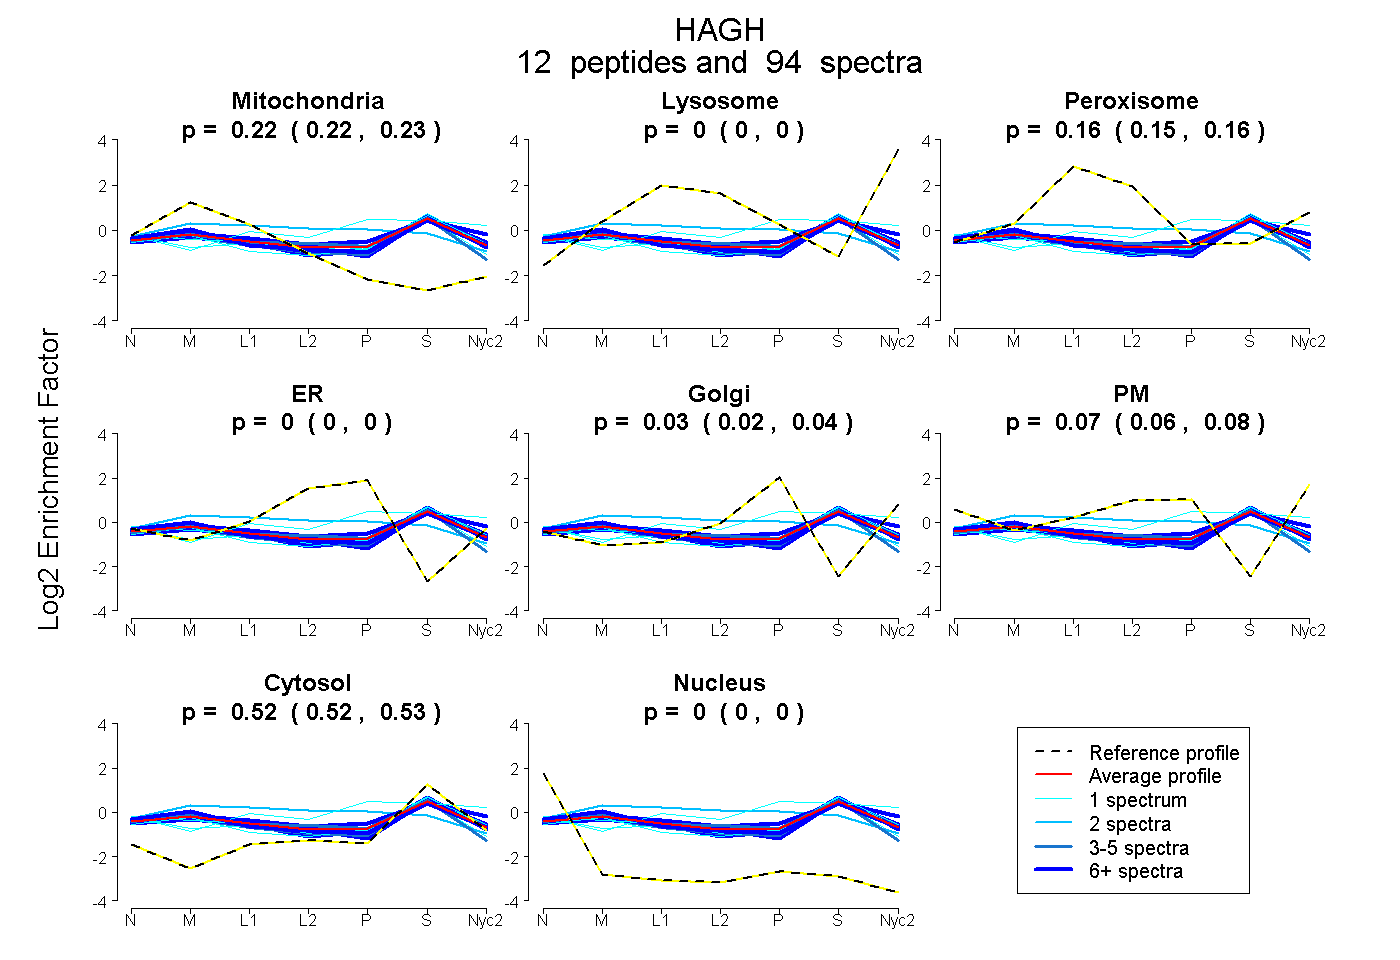
0.220 | 0.227
0.000 | 0.000
0.152 | 0.161
0.000 | 0.000
0.015 | 0.038
0.055 | 0.078
0.520 | 0.527
0.000 | 0.000
6peptides
spectra
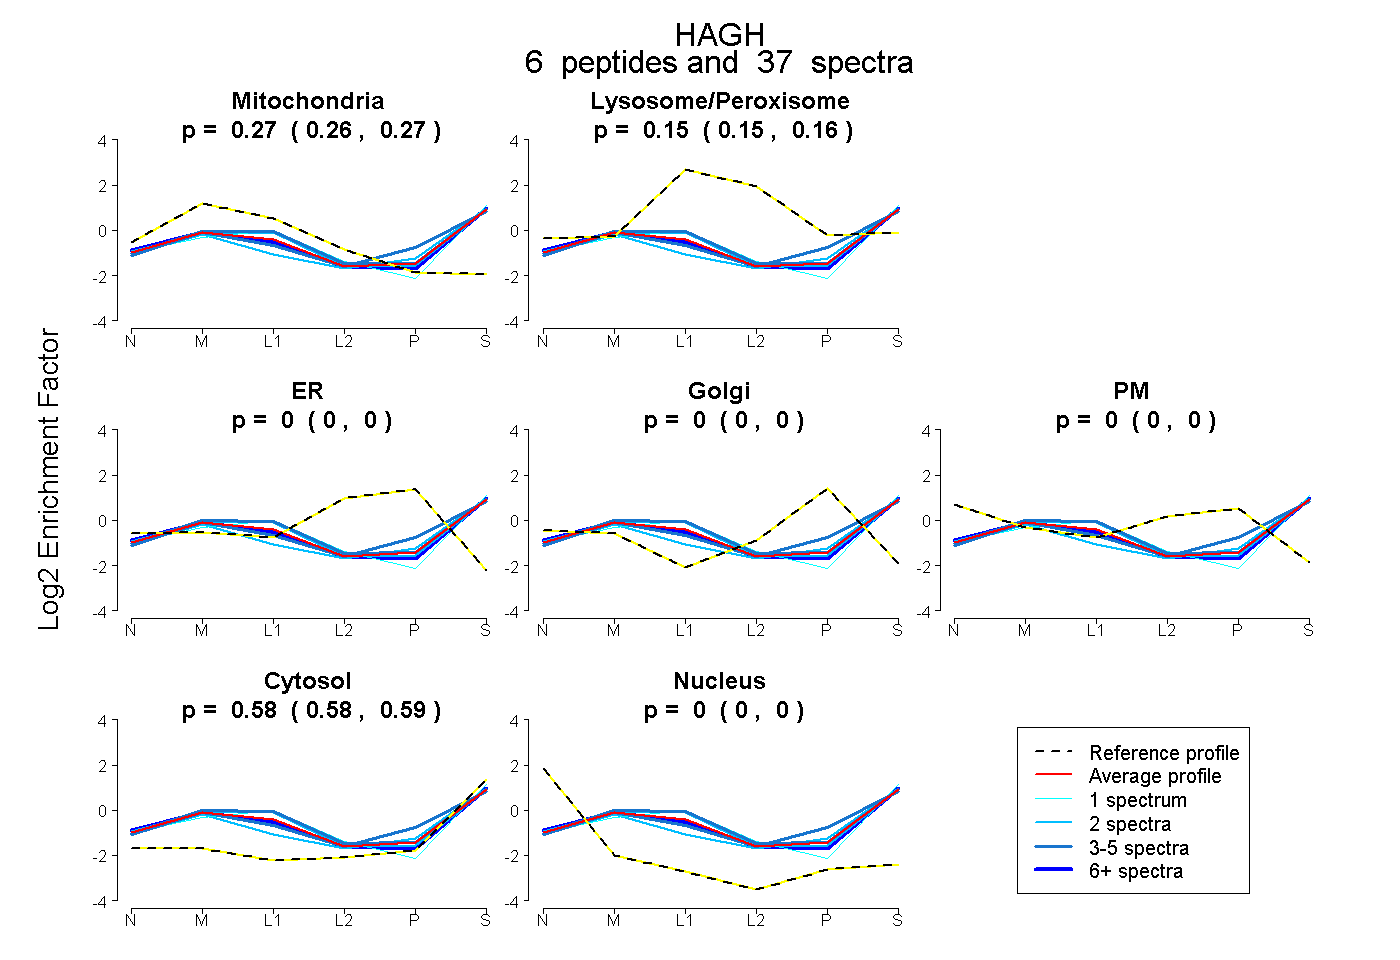
0.261 | 0.270
0.145 | 0.160
0.000 | 0.000
0.000 | 0.000
0.000 | 0.000
0.576 | 0.585
0.000 | 0.000
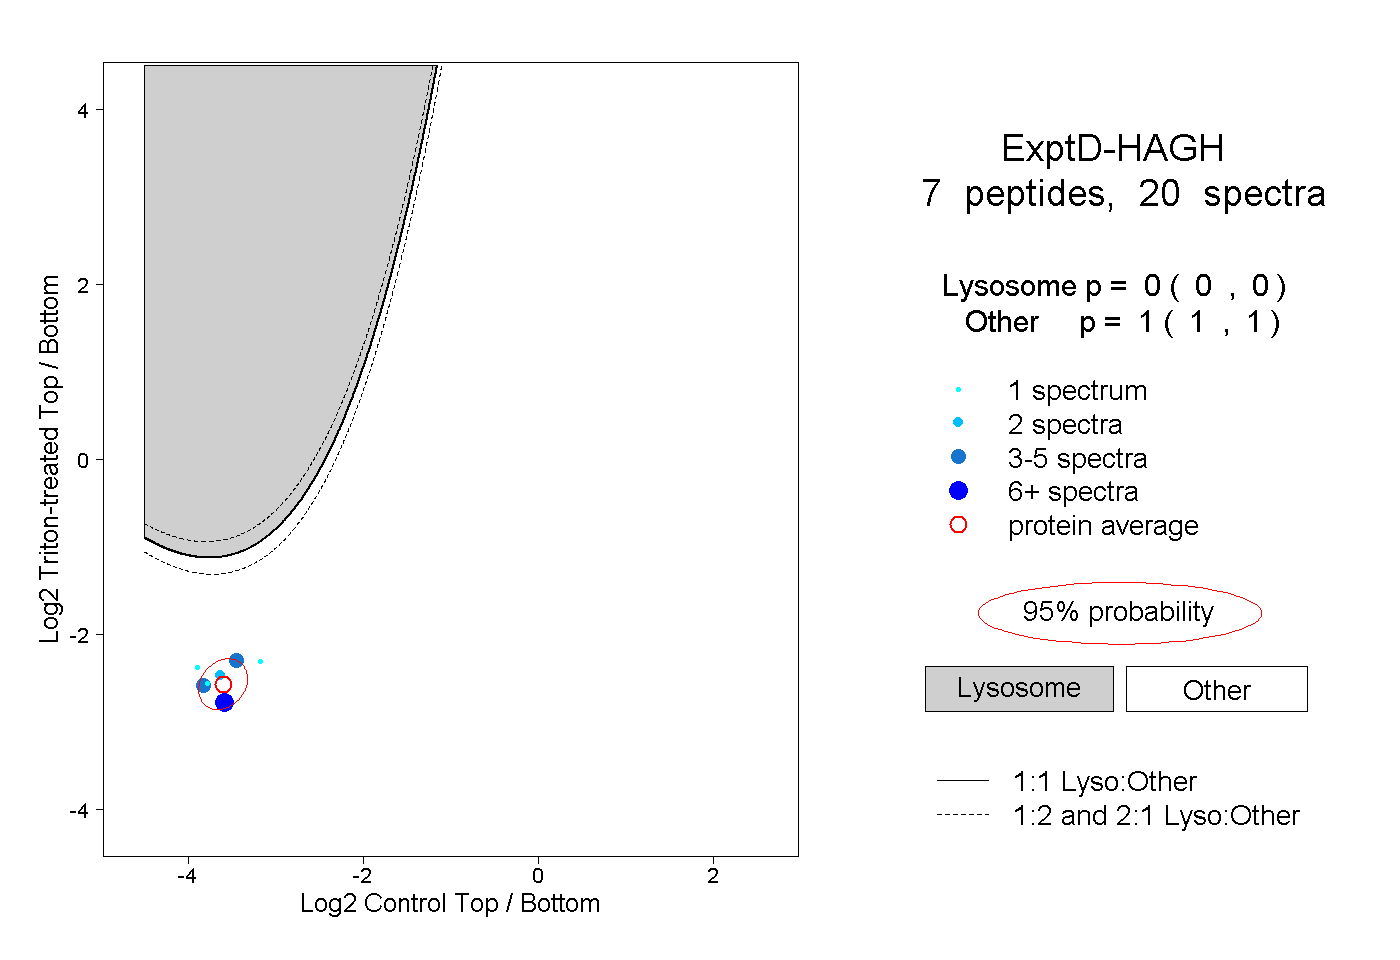
10peptides
spectra
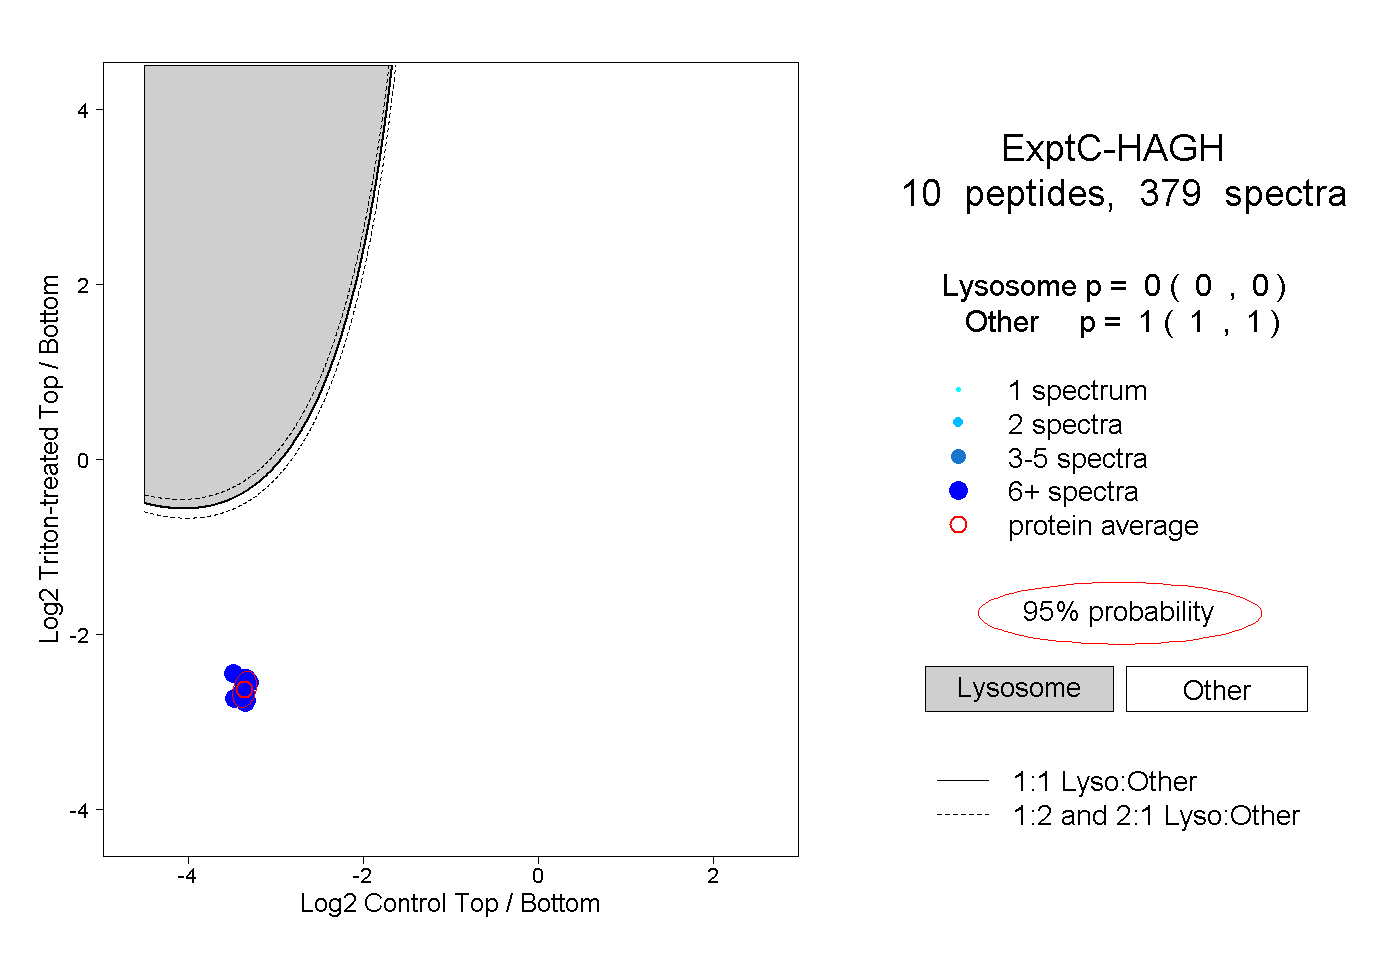
0.000 | 0.000
1.000 | 1.000