 2
2peptides
spectra
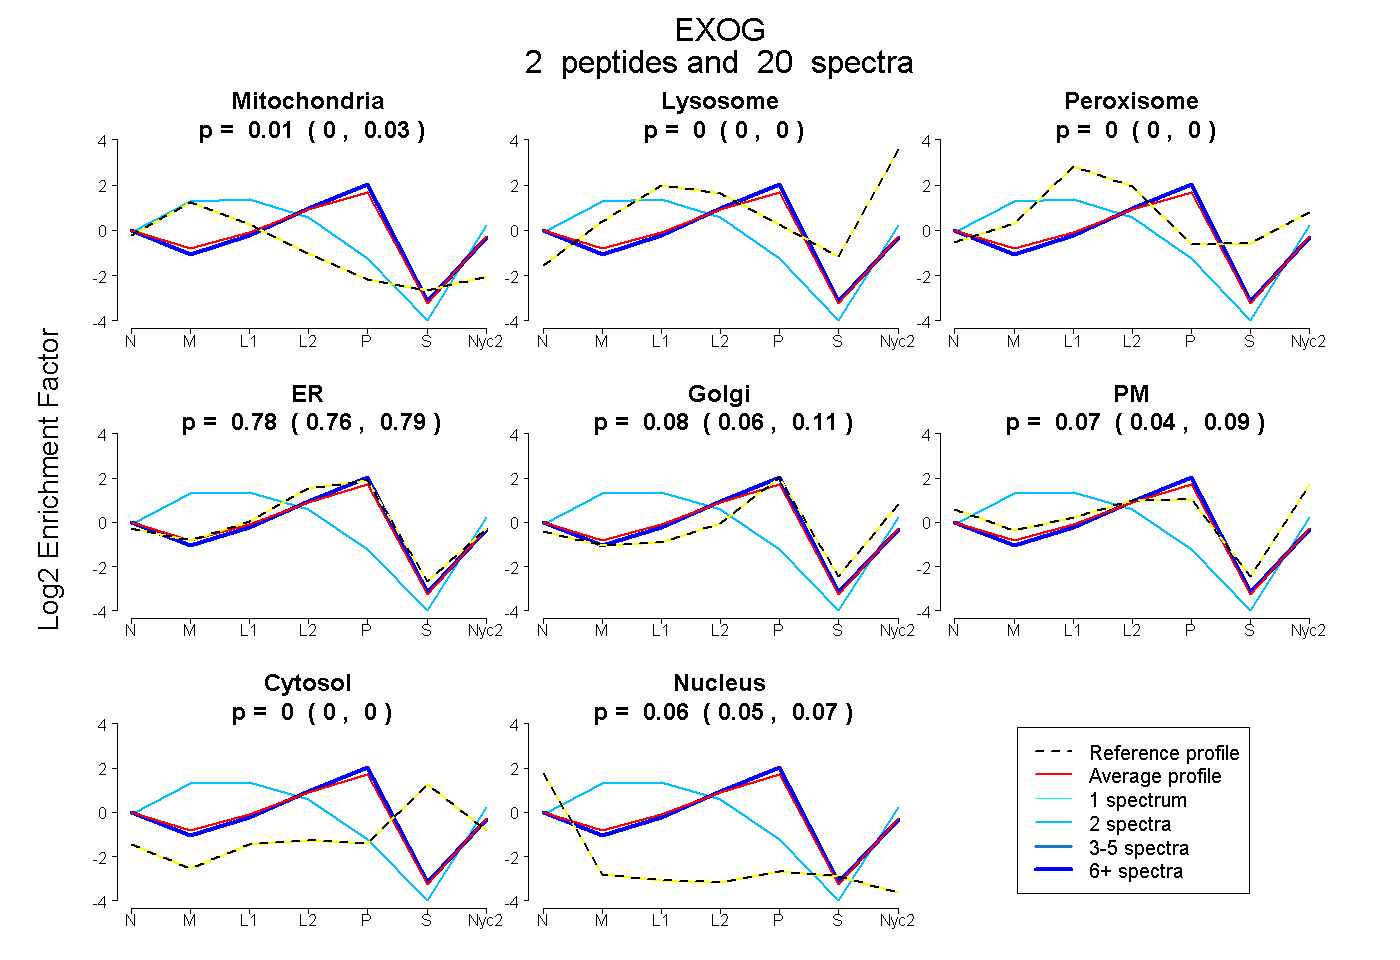
0.000 | 0.028
0.000 | 0.000
0.000 | 0.000
0.758 | 0.793
0.056 | 0.108
0.043 | 0.089
0.000 | 0.000
0.046 | 0.067
3peptides
spectra
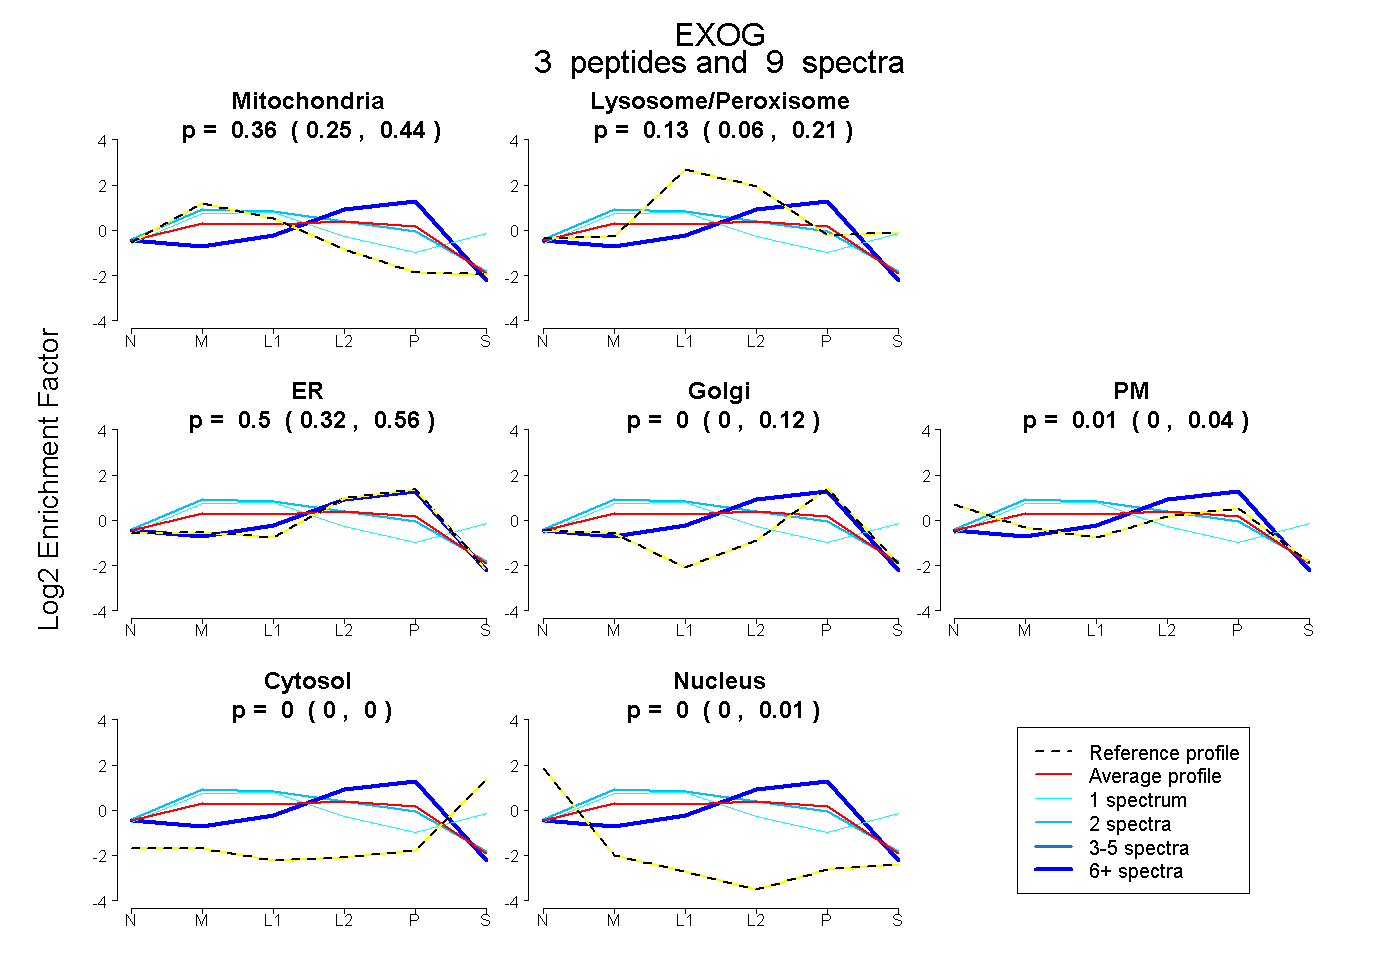
0.247 | 0.441
0.061 | 0.211
0.318 | 0.564
0.000 | 0.120
0.000 | 0.043
0.000 | 0.000
0.000 | 0.006
12peptides
spectra
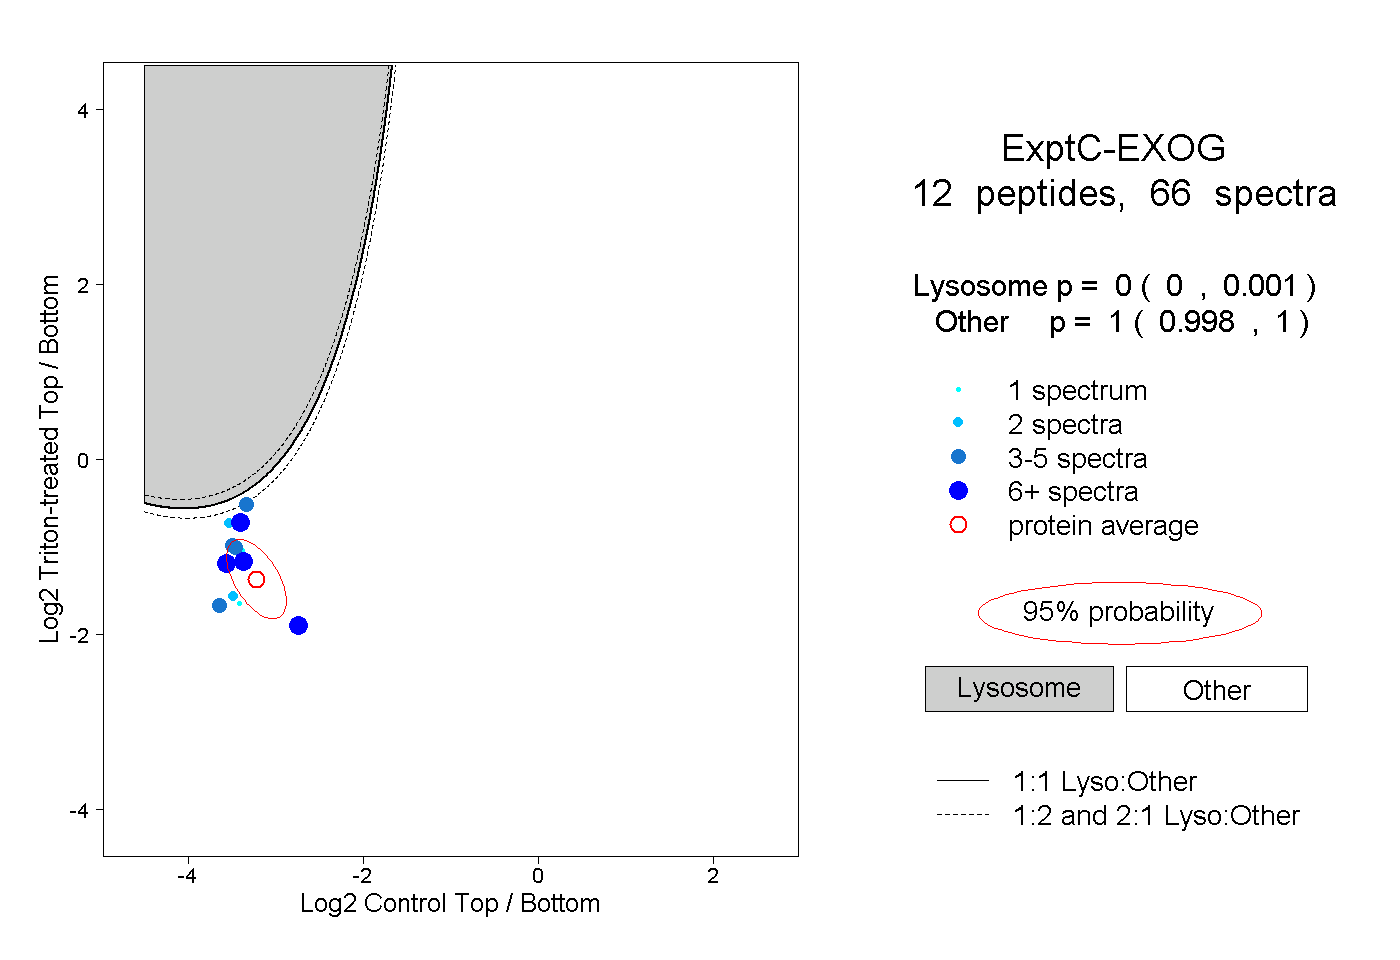
0.000 | 0.001
0.998 | 1.000
4peptides
spectra
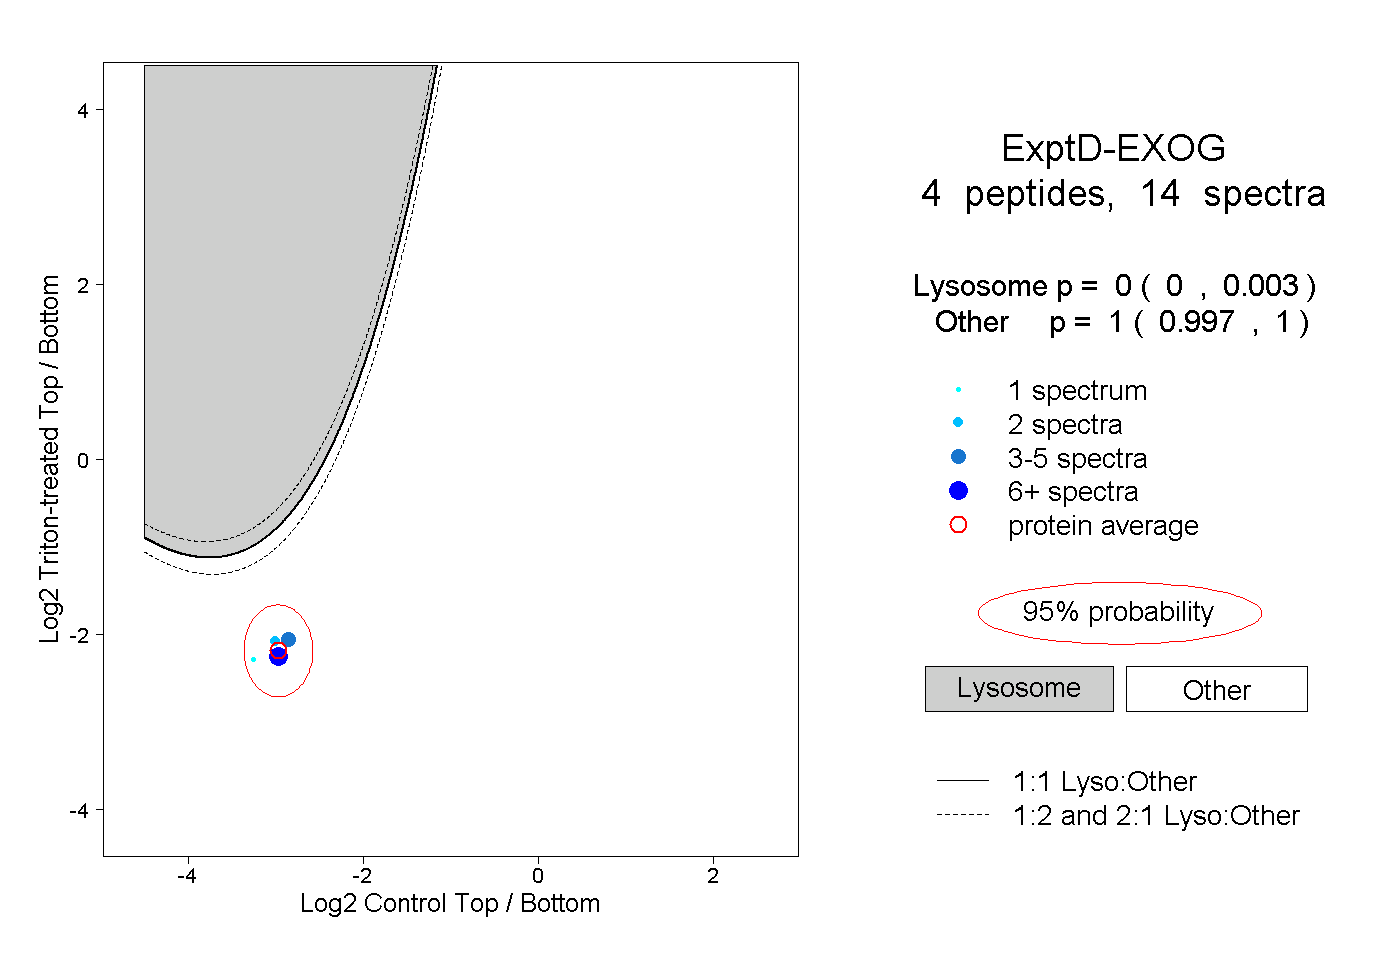
0.000 | 0.003
0.997 | 1.000