 6
6peptides
spectra
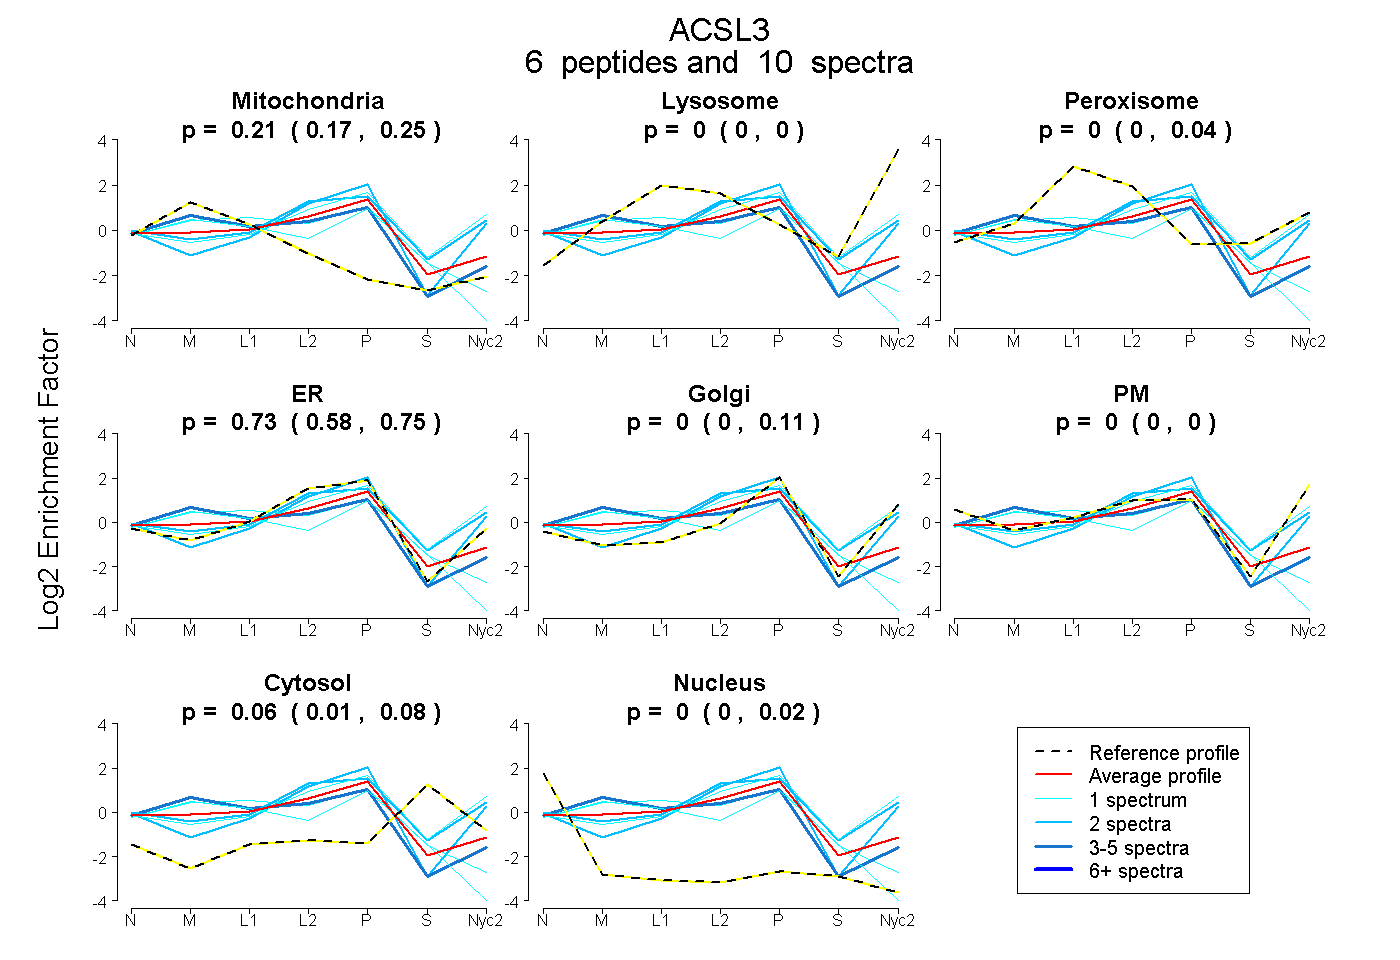
0.168 | 0.247
0.000 | 0.000
0.000 | 0.035
0.583 | 0.749
0.000 | 0.112
0.000 | 0.000
0.007 | 0.081
0.000 | 0.018
2peptides
spectra
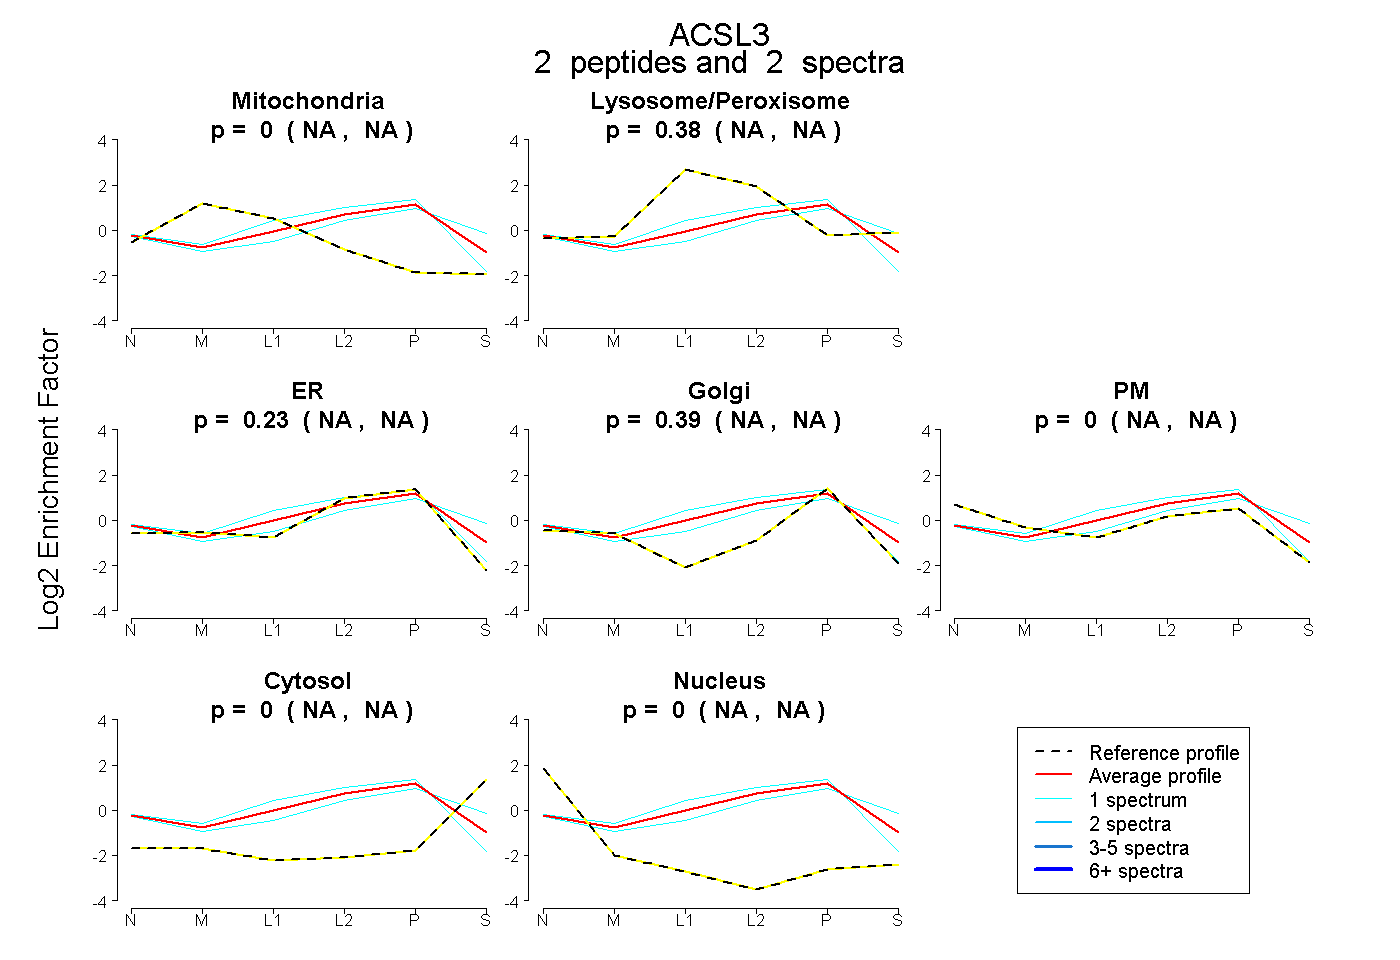
NA | NA
NA | NA
NA | NA
NA | NA
NA | NA
NA | NA
NA | NA
8peptides
spectra
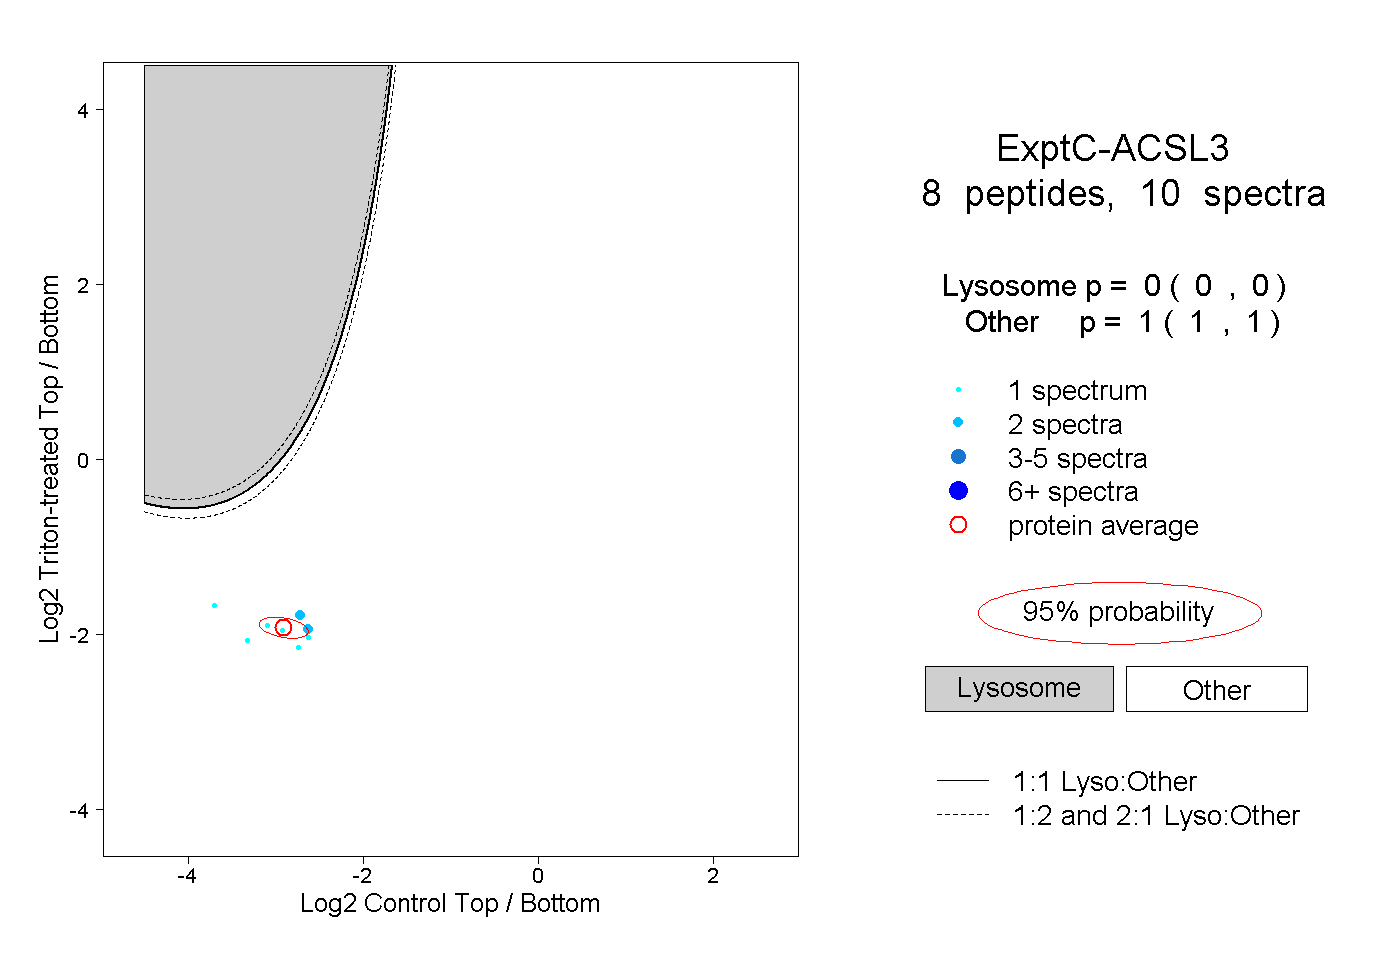
0.000 | 0.000
1.000 | 1.000
2peptides
spectra
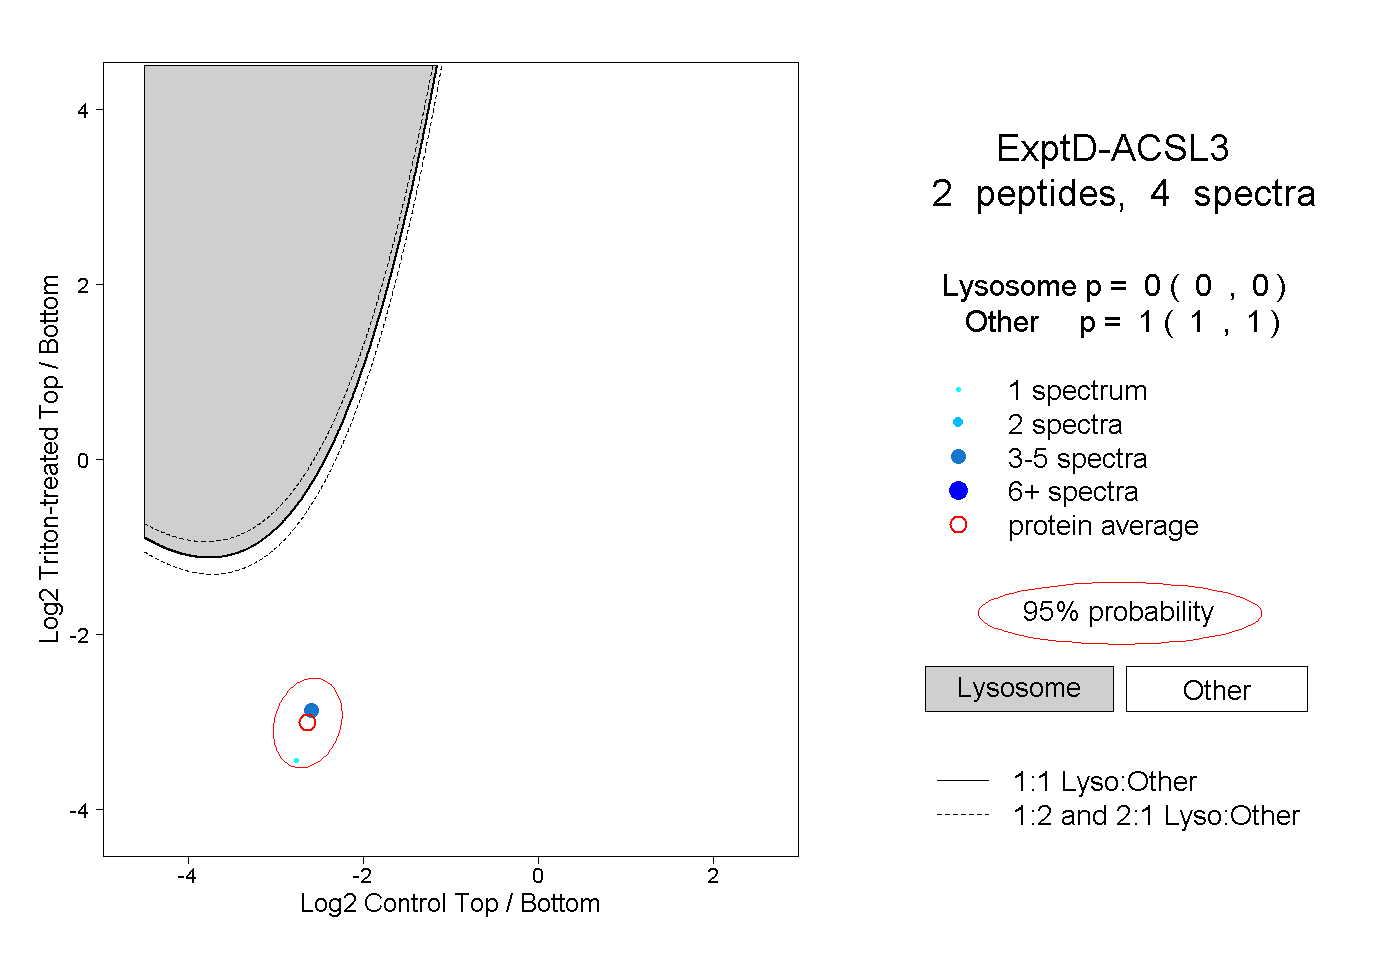
0.000 | 0.000
1.000 | 1.000