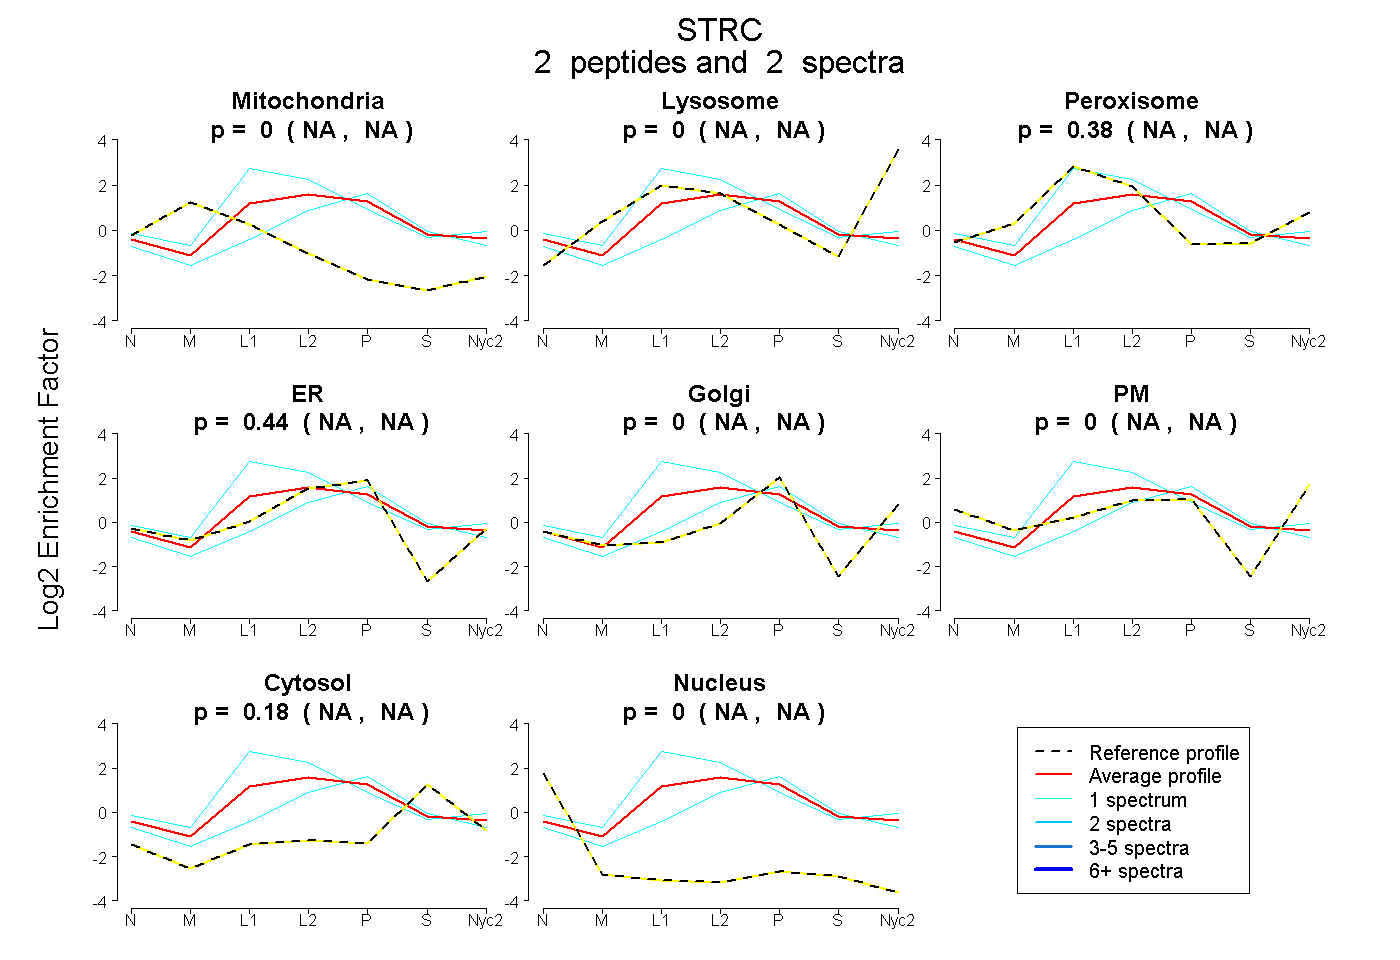
 2
2peptides
spectra
NA | NA
NA | NA
NA | NA
NA | NA
NA | NA
NA | NA
NA | NA
NA | NA
| Plot | Mito | Lyso | Perox | ER | Golgi | PM | Cytosol | Nucleus | |||||
| Expt A |
2 peptides |
2 spectra |
|
0.000 NA | NA |
0.000 NA | NA |
0.376 NA | NA |
0.444 NA | NA |
0.000 NA | NA |
0.000 NA | NA |
0.179 NA | NA |
0.000 NA | NA |
| 1 spectrum, AVVSSFLR | 0.000 | 0.000 | 0.003 | 0.619 | 0.000 | 0.000 | 0.378 | 0.000 | ||
| 1 spectrum, GVPLPR | 0.000 | 0.000 | 0.741 | 0.259 | 0.000 | 0.000 | 0.000 | 0.000 |
| Plot | Lyso | Other | |||||||||||
| Expt D |
1 peptide |
1 spectrum |
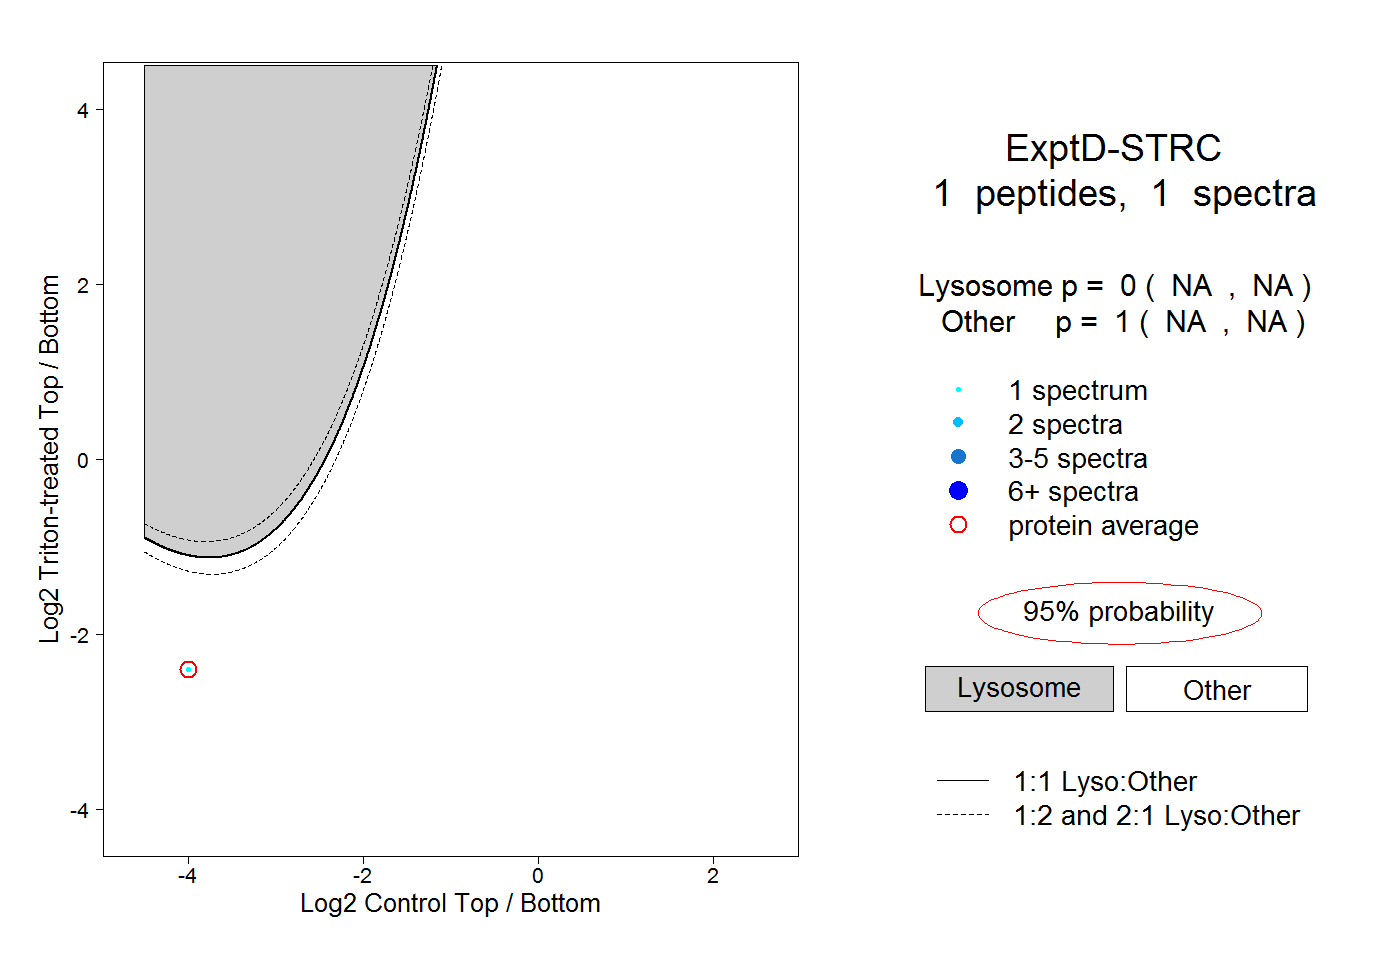 |
0.000 NA | NA |
1.000 NA | NA |