14
14peptides
spectra
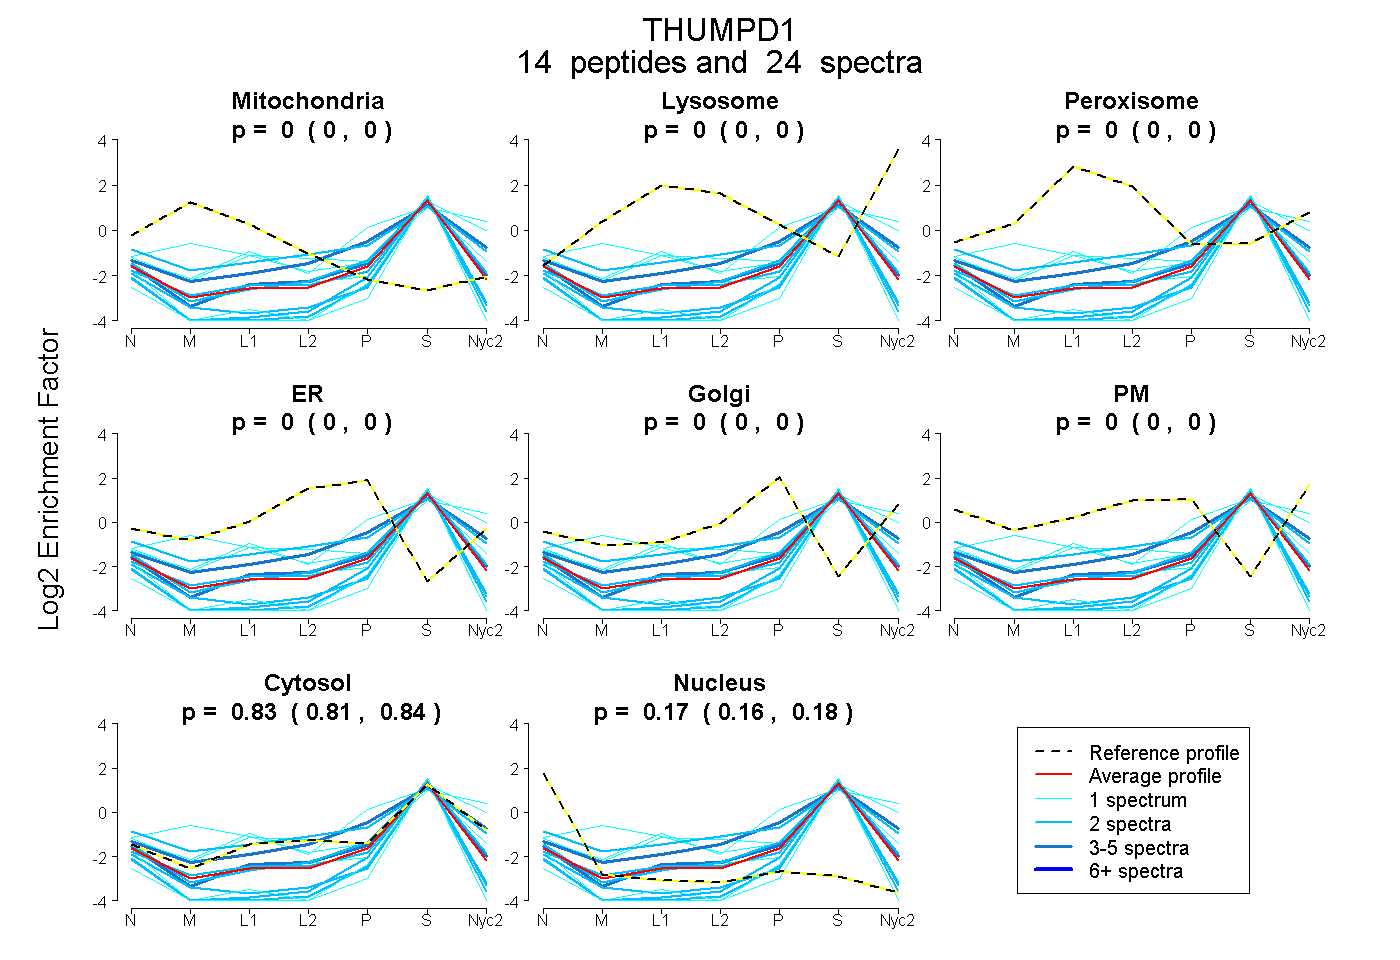
0.000 | 0.000
0.000 | 0.000
0.000 | 0.000
0.000 | 0.000
0.000 | 0.000
0.000 | 0.000
0.815 | 0.836
0.162 | 0.183
5peptides
spectra
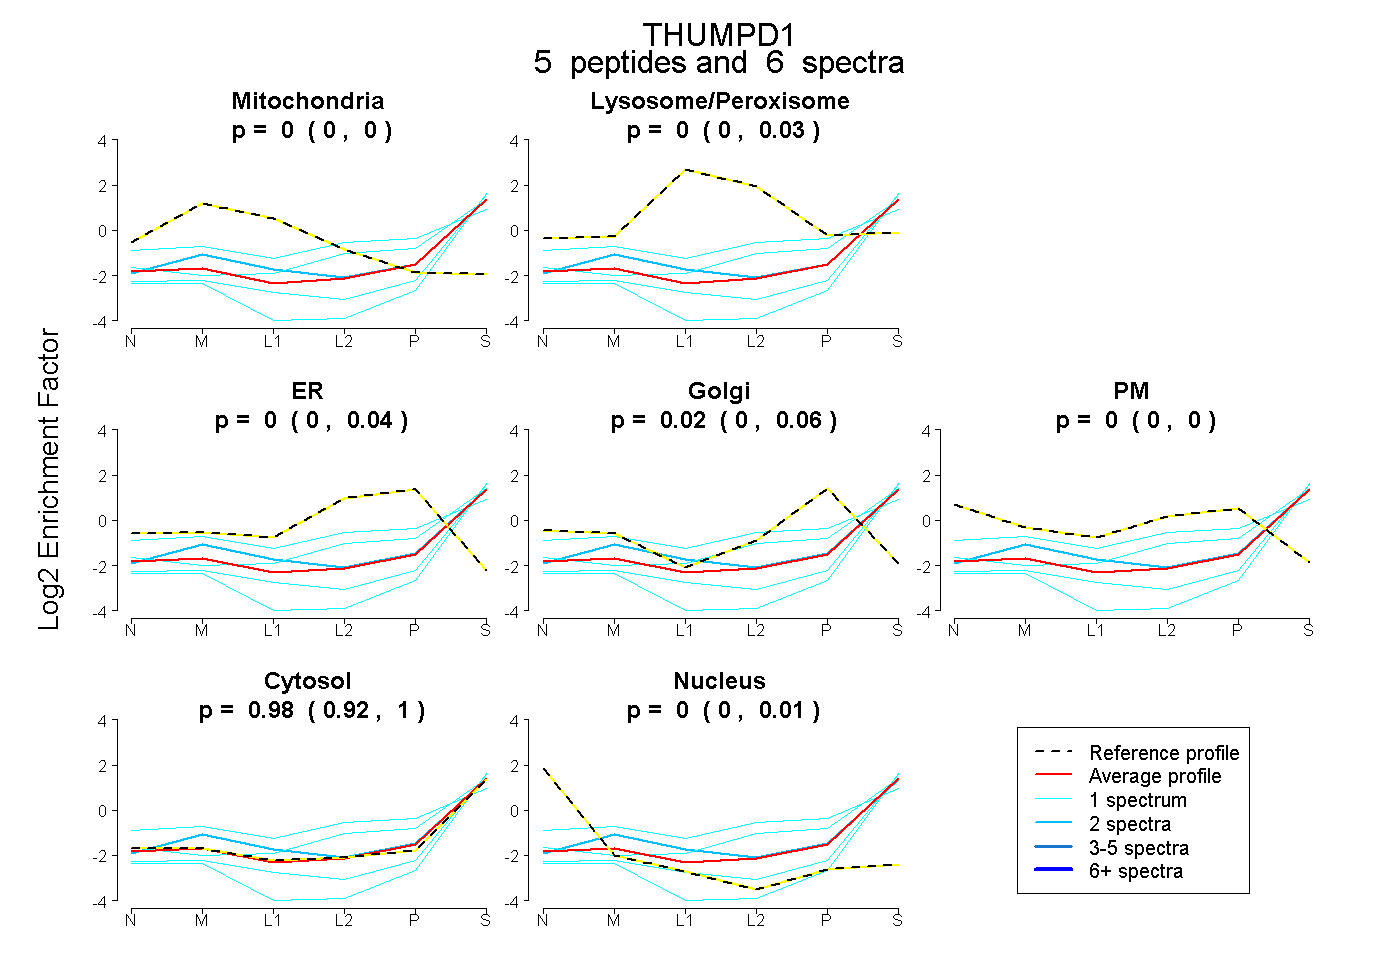
0.000 | 0.000
0.000 | 0.028
0.000 | 0.036
0.000 | 0.061
0.000 | 0.000
0.924 | 1.000
0.000 | 0.010