 14
14peptides
spectra
0.000 | 0.000
0.000 | 0.000
0.000 | 0.000
0.000 | 0.000
0.000 | 0.000
0.000 | 0.000
0.815 | 0.836
0.162 | 0.183
| Plot | Mito | Lyso | Perox | ER | Golgi | PM | Cytosol | Nucleus | |||||
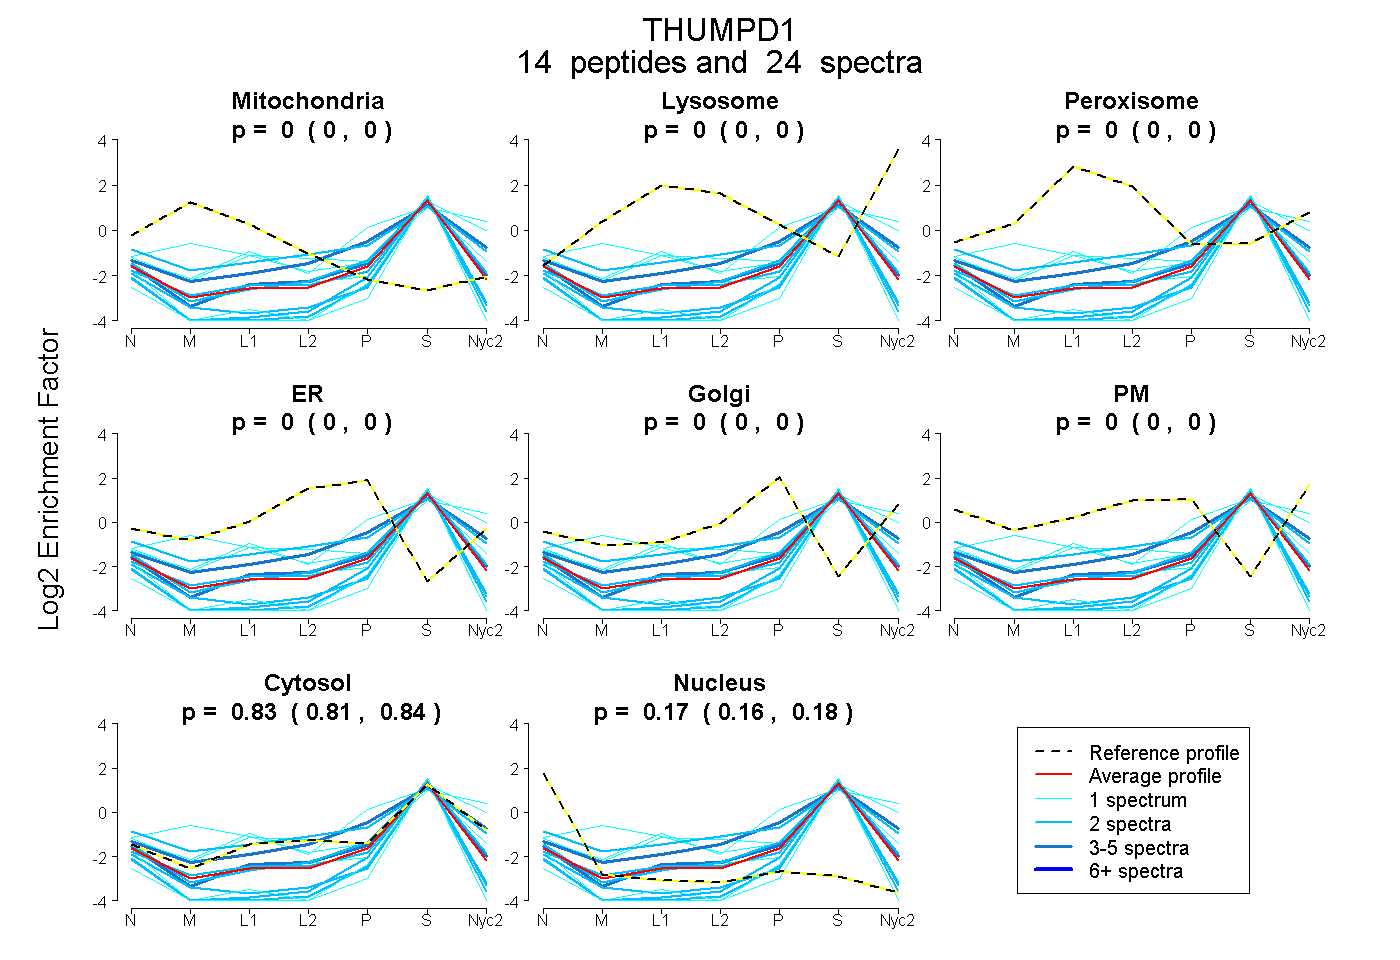
| Expt A |
14 peptides |
24 spectra |
|
0.000 0.000 | 0.000 |
0.000 0.000 | 0.000 |
0.000 0.000 | 0.000 |
0.000 0.000 | 0.000 |
0.000 0.000 | 0.000 |
0.000 0.000 | 0.000 |
0.827 0.815 | 0.836 |
0.173 0.162 | 0.183 |
| 2 spectra, SQFLPAK | 0.000 | 0.000 | 0.000 | 0.000 | 0.000 | 0.000 | 0.865 | 0.135 | ||
| 2 spectra, TLGIEPEK | 0.000 | 0.000 | 0.000 | 0.000 | 0.000 | 0.000 | 0.702 | 0.298 | ||
| 2 spectra, YNLQEVVK | 0.000 | 0.000 | 0.000 | 0.000 | 0.000 | 0.000 | 0.766 | 0.234 | ||
| 3 spectra, EAQLEPGSK | 0.000 | 0.000 | 0.000 | 0.000 | 0.000 | 0.000 | 0.854 | 0.146 | ||
| 1 spectrum, YAETFLEPWFK | 0.000 | 0.000 | 0.000 | 0.000 | 0.000 | 0.000 | 0.631 | 0.369 | ||
| 1 spectrum, MLPVSGTCK | 0.000 | 0.000 | 0.000 | 0.000 | 0.000 | 0.000 | 0.610 | 0.390 | ||
| 1 spectrum, AFLEDMK | 0.000 | 0.000 | 0.000 | 0.000 | 0.000 | 0.000 | 0.838 | 0.162 | ||
| 1 spectrum, AVCCLSVVK | 0.000 | 0.000 | 0.000 | 0.000 | 0.158 | 0.000 | 0.838 | 0.004 | ||
| 1 spectrum, GTFQIVYK | 0.000 | 0.100 | 0.000 | 0.000 | 0.000 | 0.000 | 0.900 | 0.000 | ||
| 3 spectra, LSQNDPPK | 0.000 | 0.000 | 0.000 | 0.000 | 0.117 | 0.000 | 0.883 | 0.000 | ||
| 2 spectra, DYVLFR | 0.000 | 0.000 | 0.000 | 0.000 | 0.000 | 0.000 | 0.647 | 0.353 | ||
| 2 spectra, LVHHILQDMYK | 0.040 | 0.000 | 0.000 | 0.053 | 0.072 | 0.000 | 0.835 | 0.000 | ||
| 1 spectrum, ELAGIVGSLNSENK | 0.129 | 0.150 | 0.000 | 0.000 | 0.000 | 0.000 | 0.721 | 0.000 | ||
| 2 spectra, FQSVESGANNVVFIR | 0.000 | 0.000 | 0.000 | 0.000 | 0.000 | 0.000 | 0.675 | 0.325 |
| Plot | Mito | Lyso or Perox | ER | Golgi | PM | Cytosol | Nucleus | ||||||
| Expt B |
5 peptides |
6 spectra |
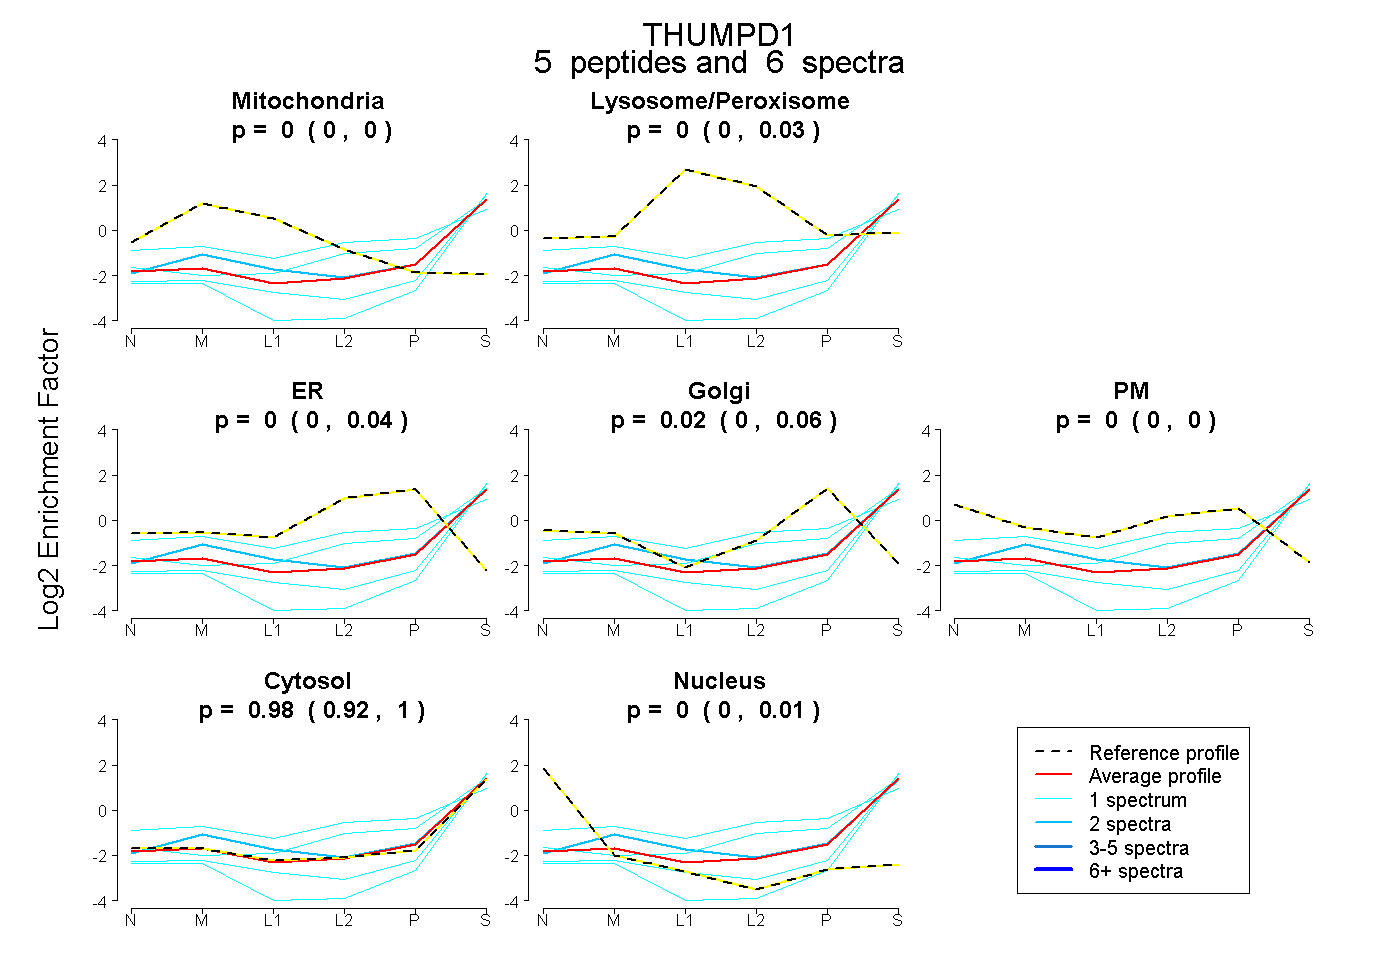 |
0.000 0.000 | 0.000 |
0.000 0.000 | 0.028 |
0.000 0.000 | 0.036 |
0.023 0.000 | 0.061 |
0.000 0.000 | 0.000 |
0.977 0.924 | 1.000 |
0.000 0.000 | 0.010 |
|||
| Plot | Lyso | Other | |||||||||||
| Expt C |
1 peptide |
1 spectrum |
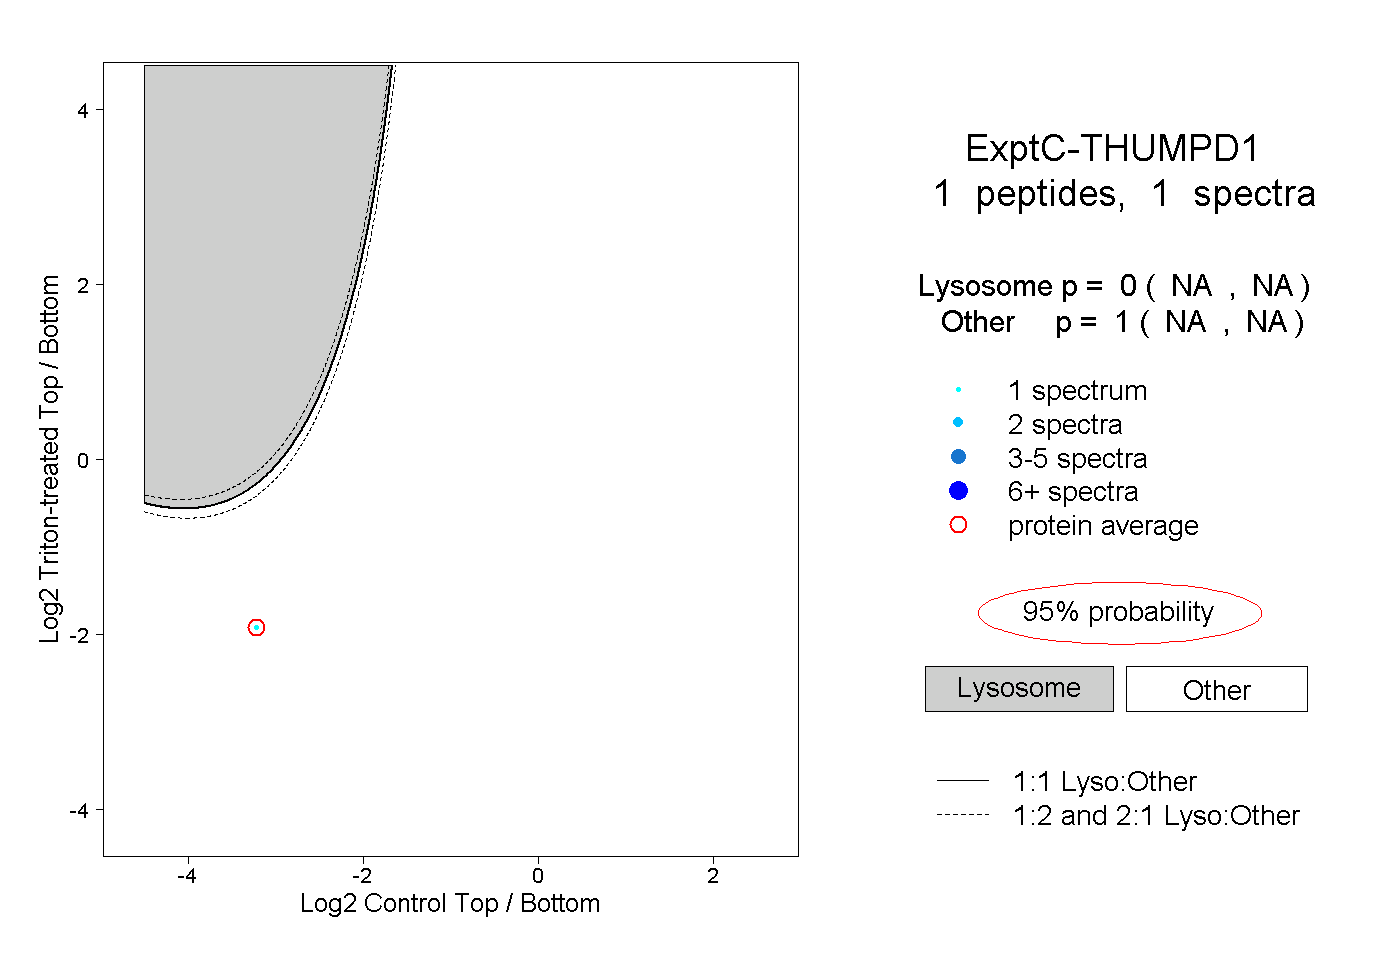 |
0.000 NA | NA |
1.000 NA | NA |