 2
2peptides
spectra
NA | NA
NA | NA
NA | NA
NA | NA
NA | NA
NA | NA
NA | NA
NA | NA
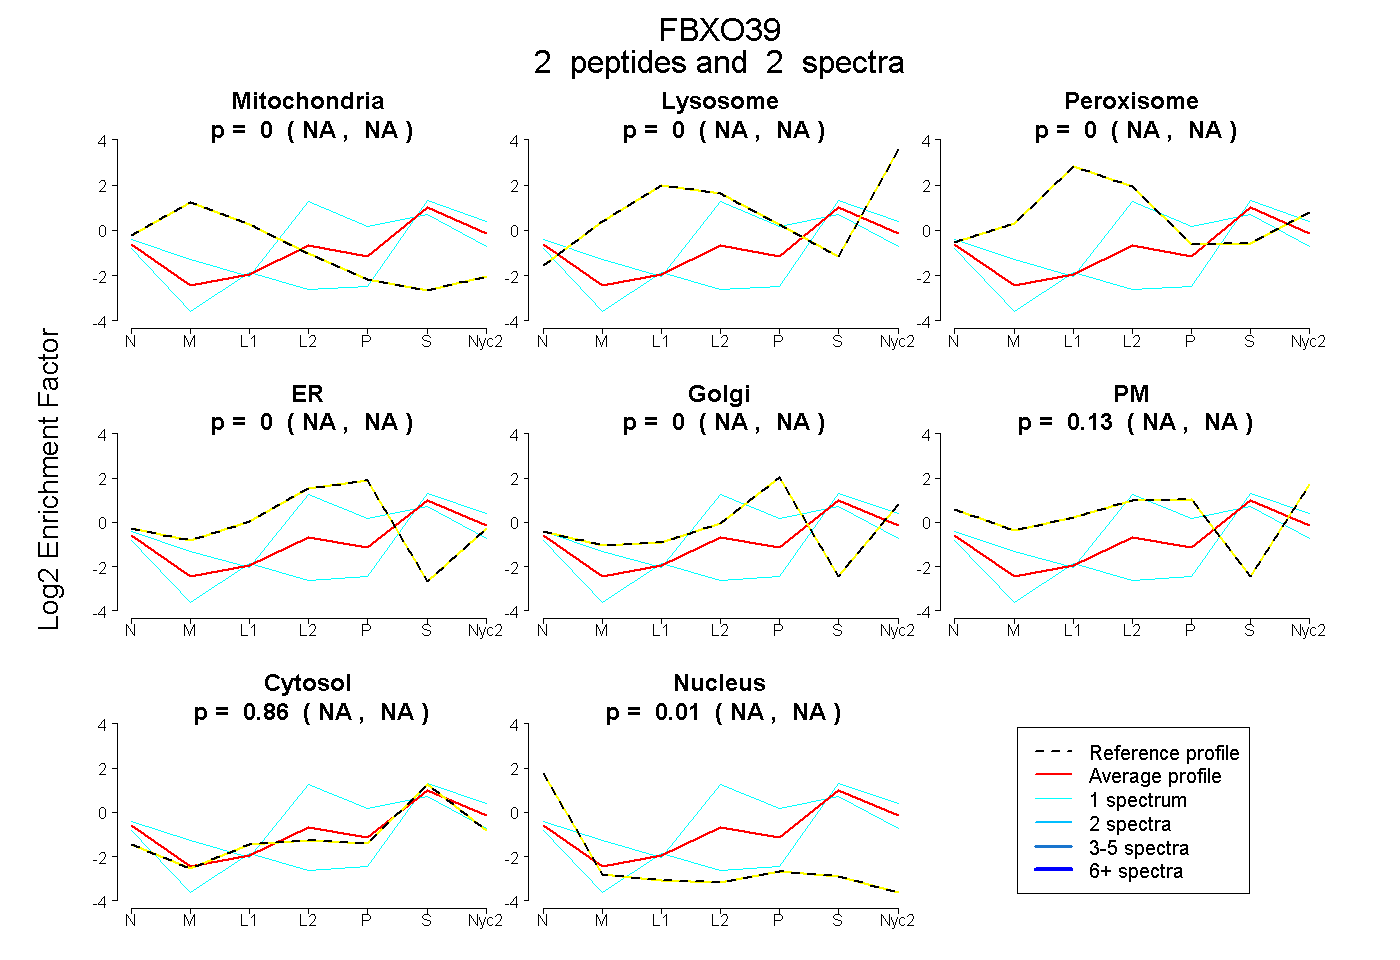
| Plot | Mito | Lyso | Perox | ER | Golgi | PM | Cytosol | Nucleus | |||||
| Expt A |
2 peptides |
2 spectra |
|
0.000 NA | NA |
0.000 NA | NA |
0.000 NA | NA |
0.000 NA | NA |
0.000 NA | NA |
0.130 NA | NA |
0.858 NA | NA |
0.013 NA | NA |
| 1 spectrum, ILLQEIPVR | 0.000 | 0.000 | 0.000 | 0.000 | 0.000 | 0.000 | 0.928 | 0.072 | ||
| 1 spectrum, VNFFFER | 0.000 | 0.000 | 0.000 | 0.414 | 0.000 | 0.000 | 0.586 | 0.000 |
| Plot | Mito | Lyso or Perox | ER | Golgi | PM | Cytosol | Nucleus | ||||||
| Expt B |
2 peptides |
2 spectra |
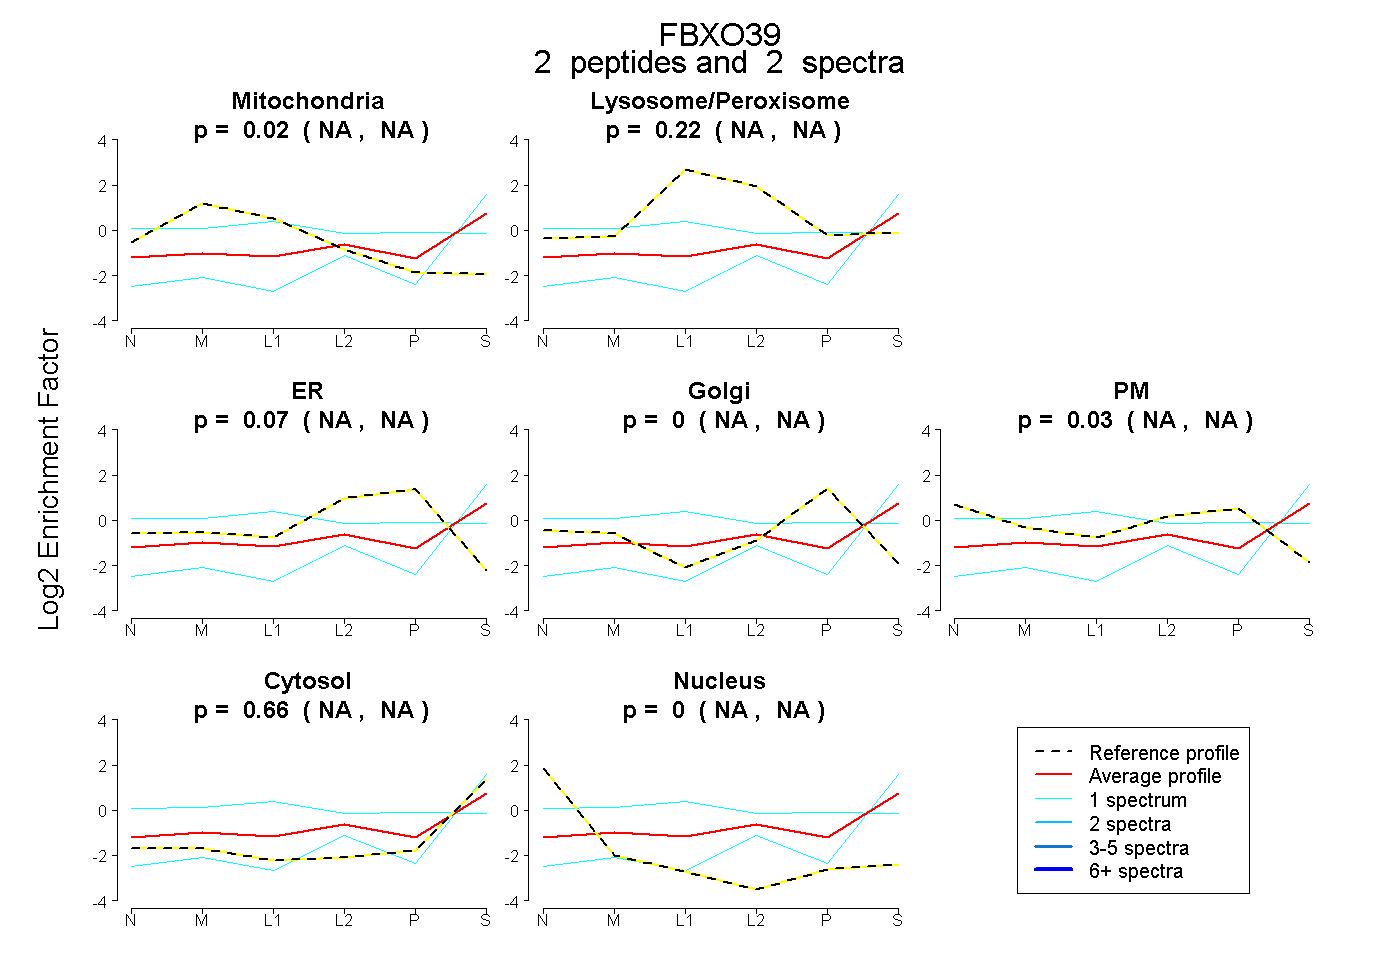 |
0.016 NA | NA |
0.219 NA | NA |
0.071 NA | NA |
0.000 NA | NA |
0.035 NA | NA |
0.659 NA | NA |
0.000 NA | NA |