 4
4peptides
spectra
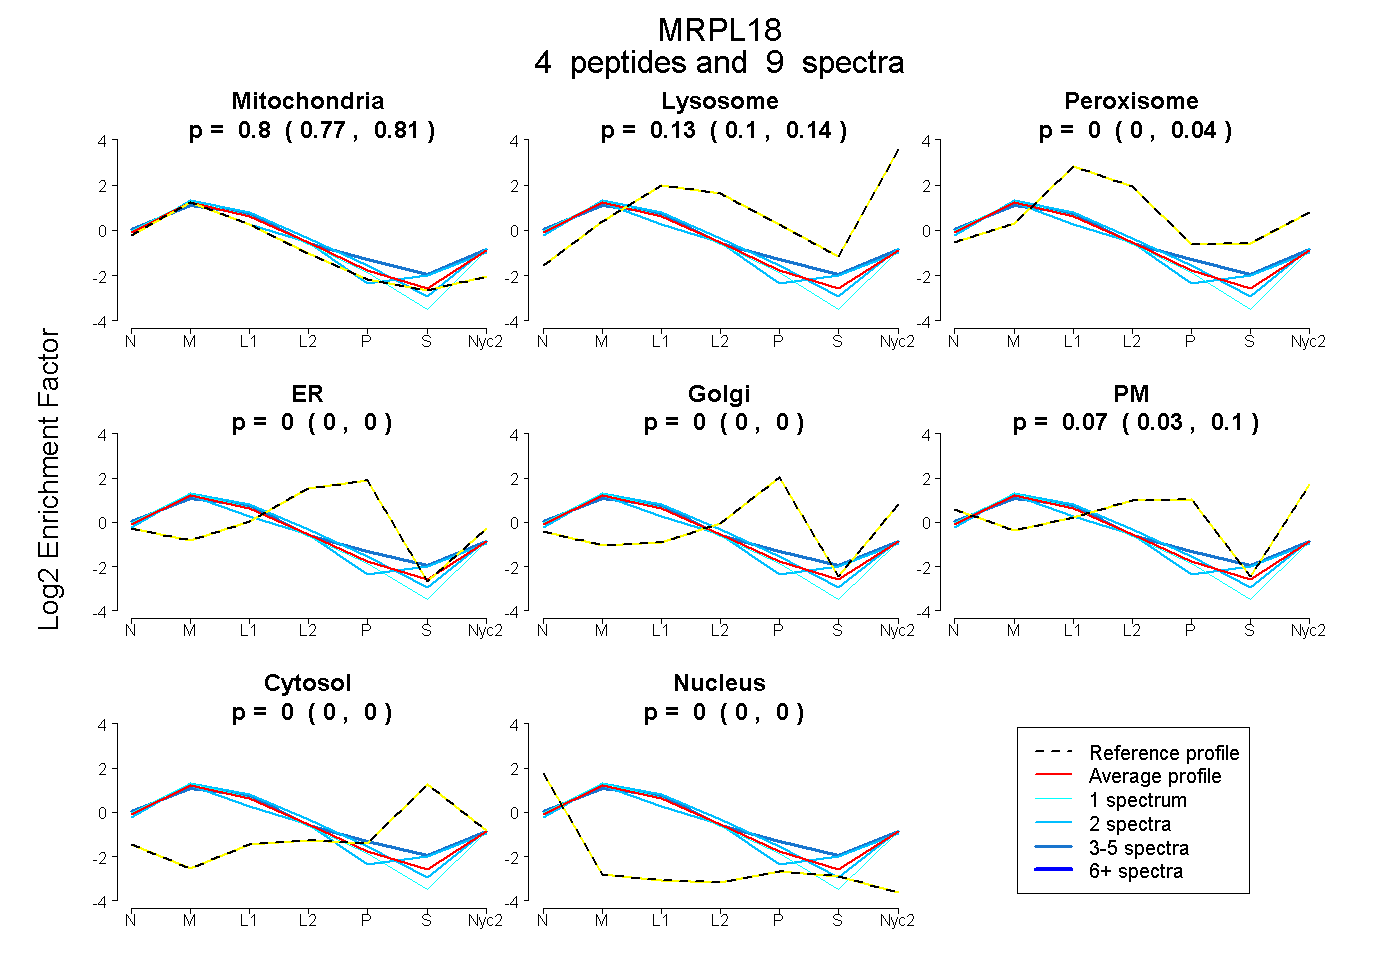
0.773 | 0.809
0.103 | 0.145
0.000 | 0.038
0.000 | 0.000
0.000 | 0.000
0.035 | 0.105
0.000 | 0.000
0.000 | 0.000
1peptide
spectrum
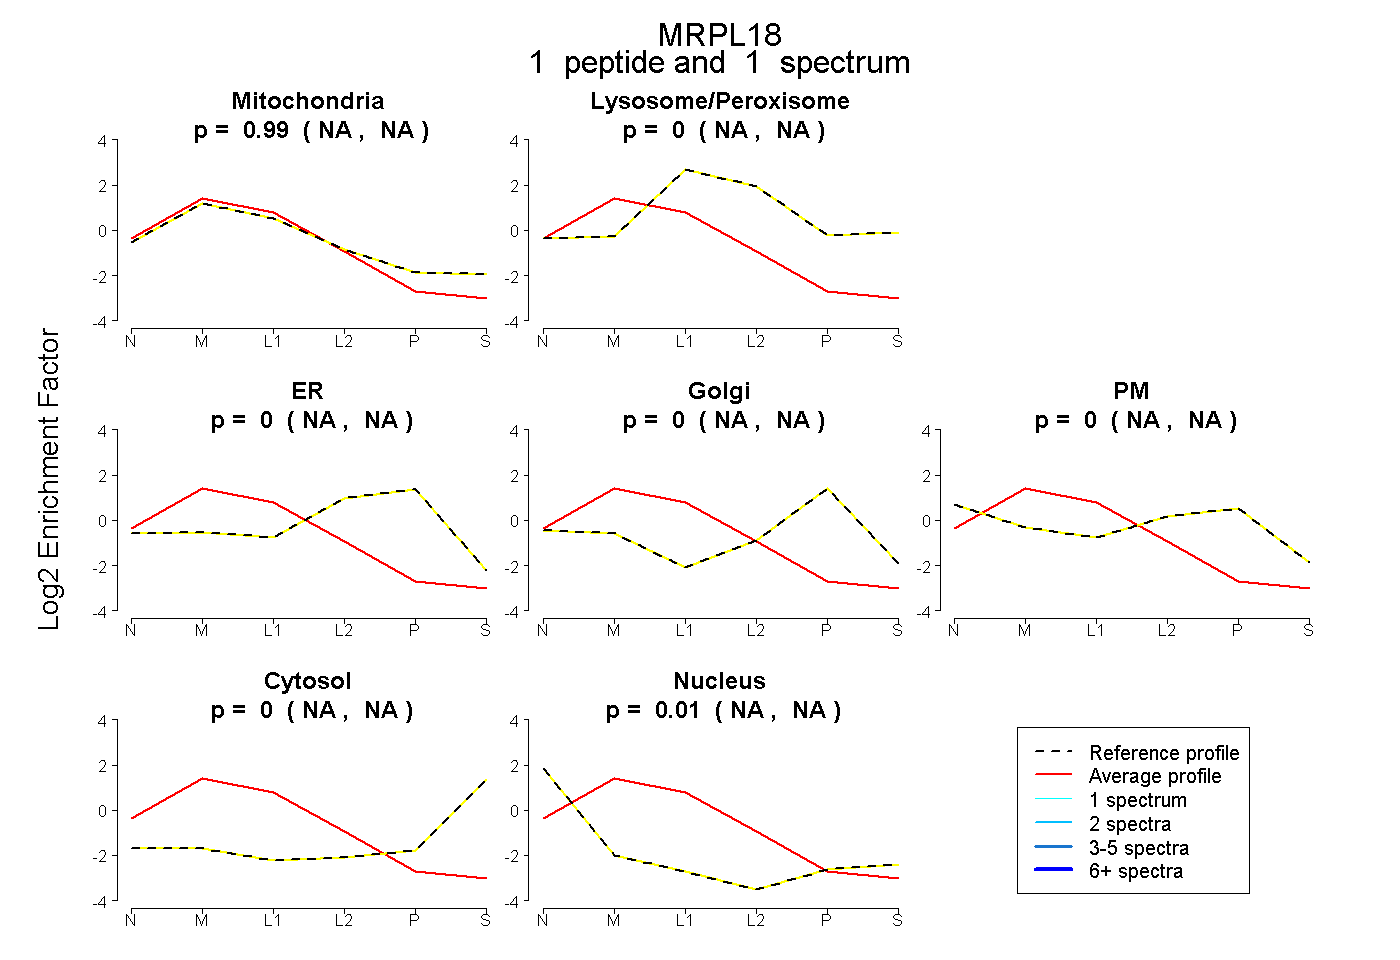
NA | NA
NA | NA
NA | NA
NA | NA
NA | NA
NA | NA
NA | NA
3peptides
spectra
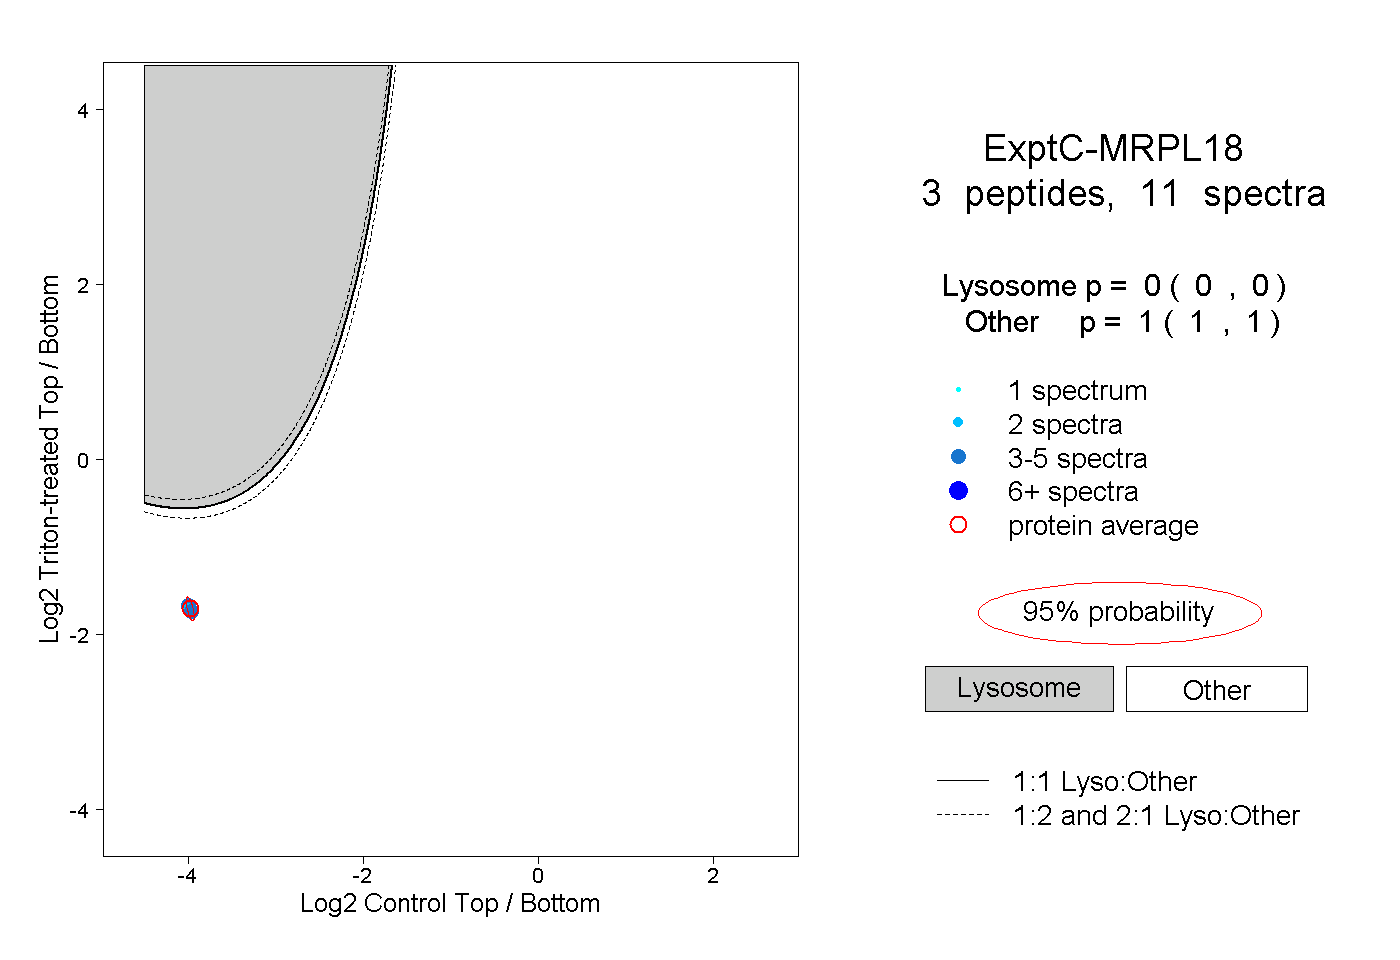
0.000 | 0.000
1.000 | 1.000