 2
2peptides
spectra
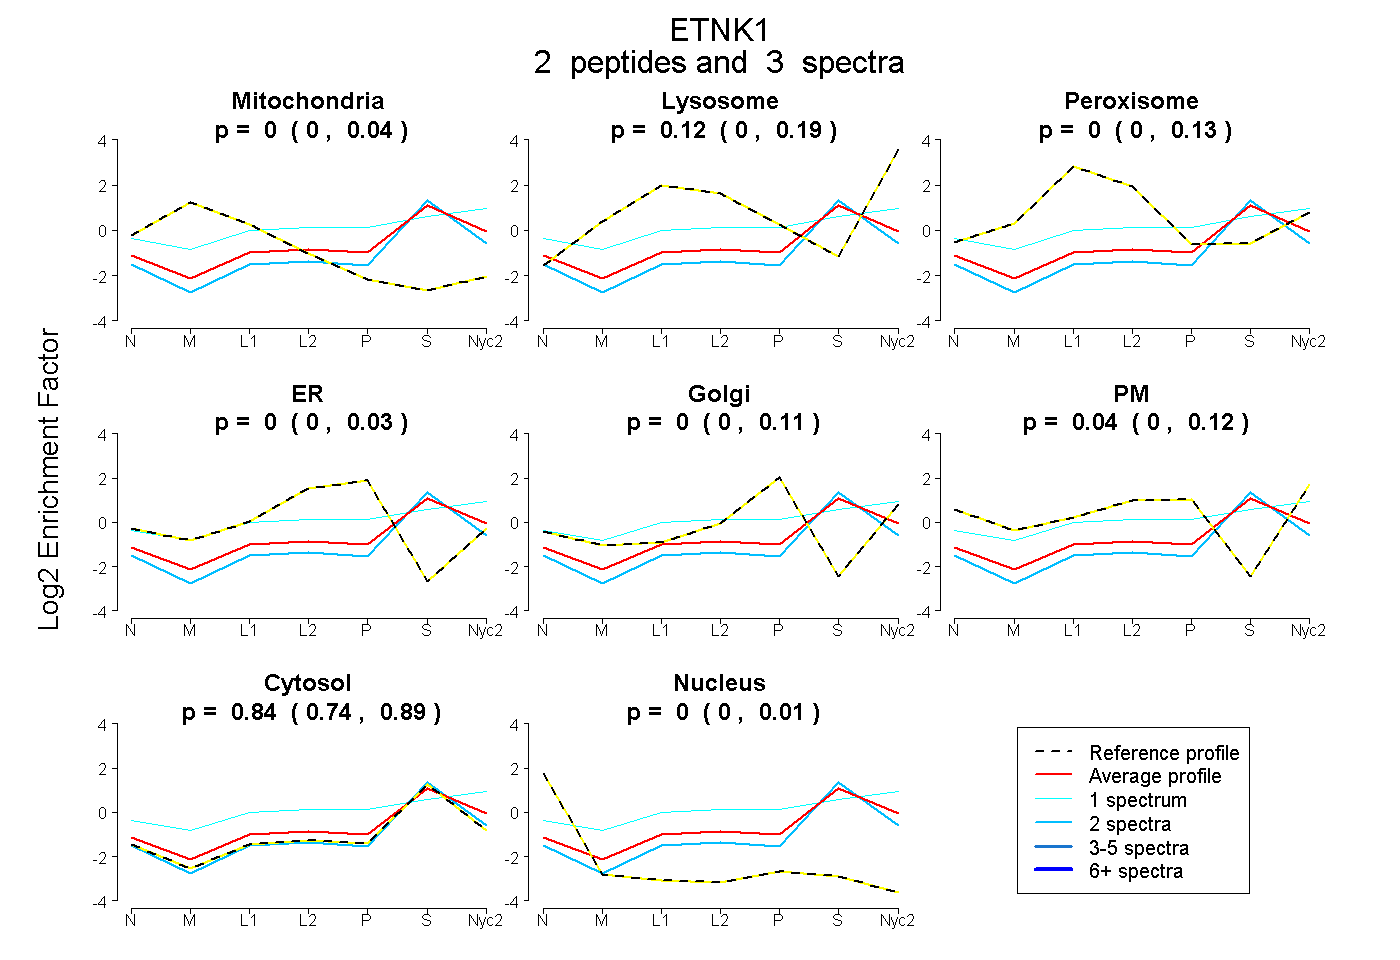
0.000 | 0.038
0.000 | 0.188
0.000 | 0.134
0.000 | 0.035
0.000 | 0.113
0.000 | 0.117
0.739 | 0.893
0.000 | 0.012
| Plot | Mito | Lyso | Perox | ER | Golgi | PM | Cytosol | Nucleus | |||||
| Expt A |
2 peptides |
3 spectra |
|
0.000 0.000 | 0.038 |
0.116 0.000 | 0.188 |
0.000 0.000 | 0.134 |
0.000 0.000 | 0.035 |
0.000 0.000 | 0.113 |
0.042 0.000 | 0.117 |
0.842 0.739 | 0.893 |
0.000 0.000 | 0.012 |
| 1 spectrum, LDVTVQDQEEQR | 0.000 | 0.197 | 0.106 | 0.000 | 0.000 | 0.233 | 0.464 | 0.000 | ||
| 2 spectra, FNQYFK | 0.000 | 0.000 | 0.000 | 0.000 | 0.000 | 0.000 | 1.000 | 0.000 |
| Plot | Lyso | Other | |||||||||||
| Expt C |
1 peptide |
2 spectra |
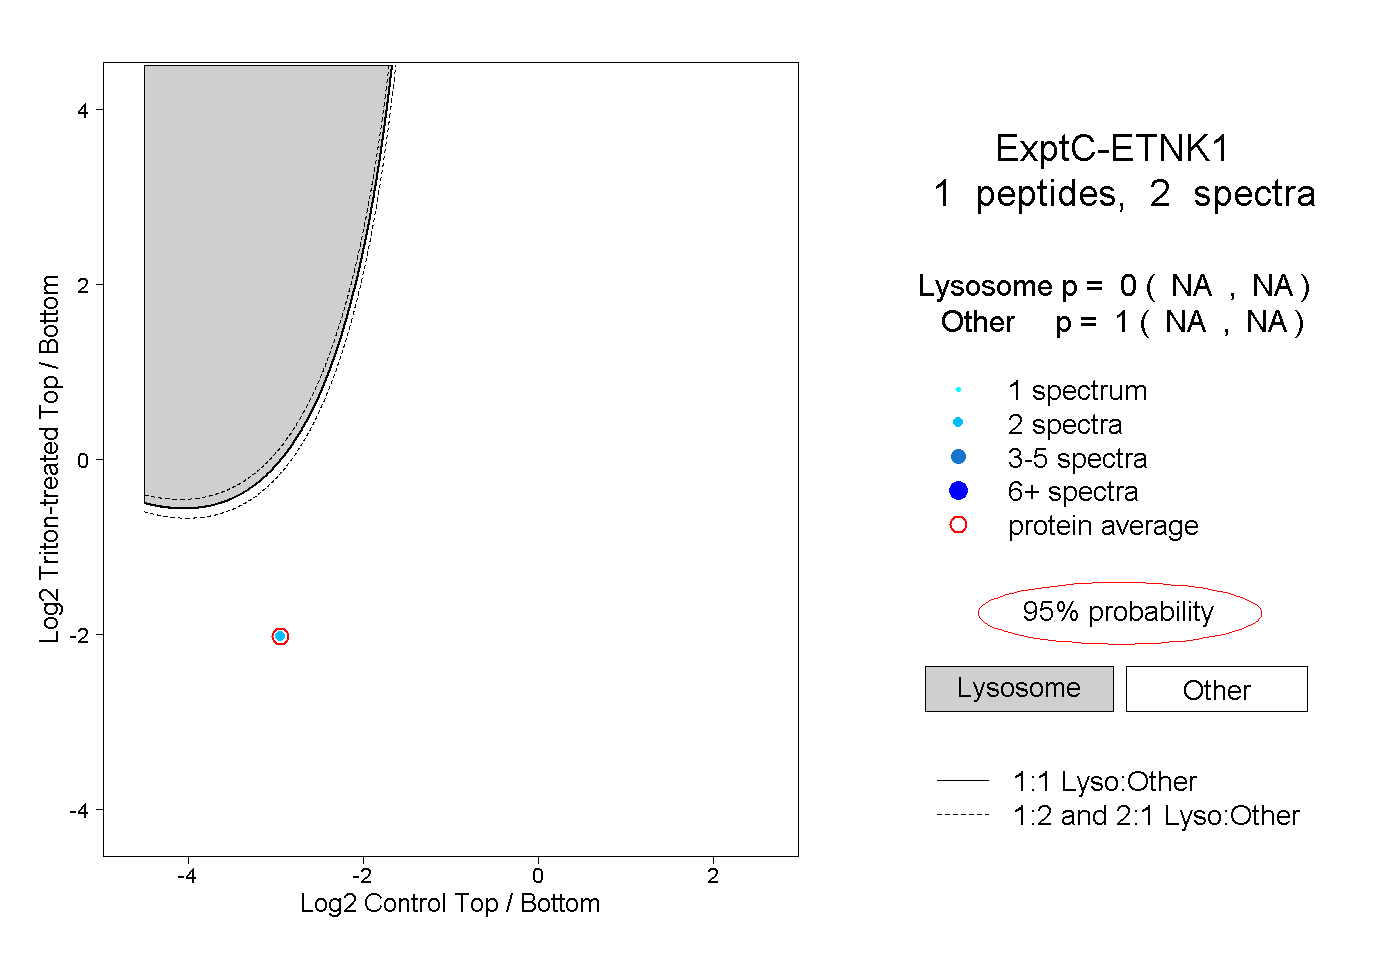 |
0.000 NA | NA |
1.000 NA | NA |