 3
3peptides
spectra
0.000 | 0.000
0.000 | 0.000
0.000 | 0.000
0.367 | 0.598
0.295 | 0.527
0.000 | 0.000
0.000 | 0.000
0.062 | 0.110
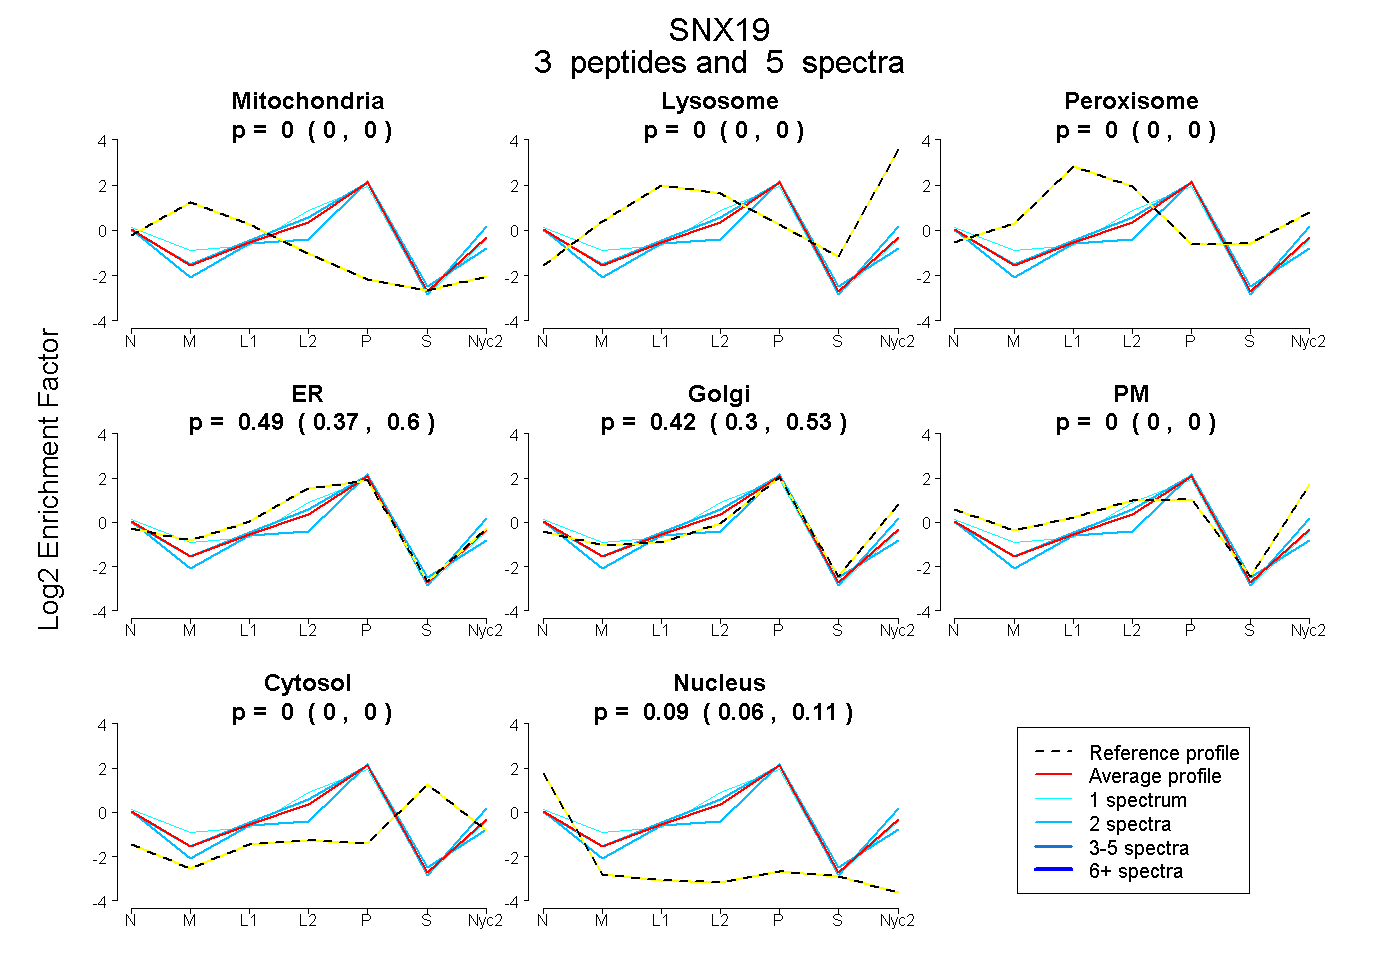
| Plot | Mito | Lyso | Perox | ER | Golgi | PM | Cytosol | Nucleus | |||||
| Expt A |
3 peptides |
5 spectra |
|
0.000 0.000 | 0.000 |
0.000 0.000 | 0.000 |
0.000 0.000 | 0.000 |
0.491 0.367 | 0.598 |
0.421 0.295 | 0.527 |
0.000 0.000 | 0.000 |
0.000 0.000 | 0.000 |
0.088 0.062 | 0.110 |
| 2 spectra, GIVNLILK | 0.000 | 0.000 | 0.000 | 0.456 | 0.509 | 0.000 | 0.000 | 0.035 | ||
| 1 spectrum, FPRPGR | 0.000 | 0.000 | 0.000 | 0.699 | 0.228 | 0.000 | 0.000 | 0.073 | ||
| 2 spectra, SLLESFLR | 0.000 | 0.000 | 0.000 | 0.323 | 0.517 | 0.000 | 0.000 | 0.160 |
| Plot | Mito | Lyso or Perox | ER | Golgi | PM | Cytosol | Nucleus | ||||||
| Expt B |
1 peptide |
1 spectrum |
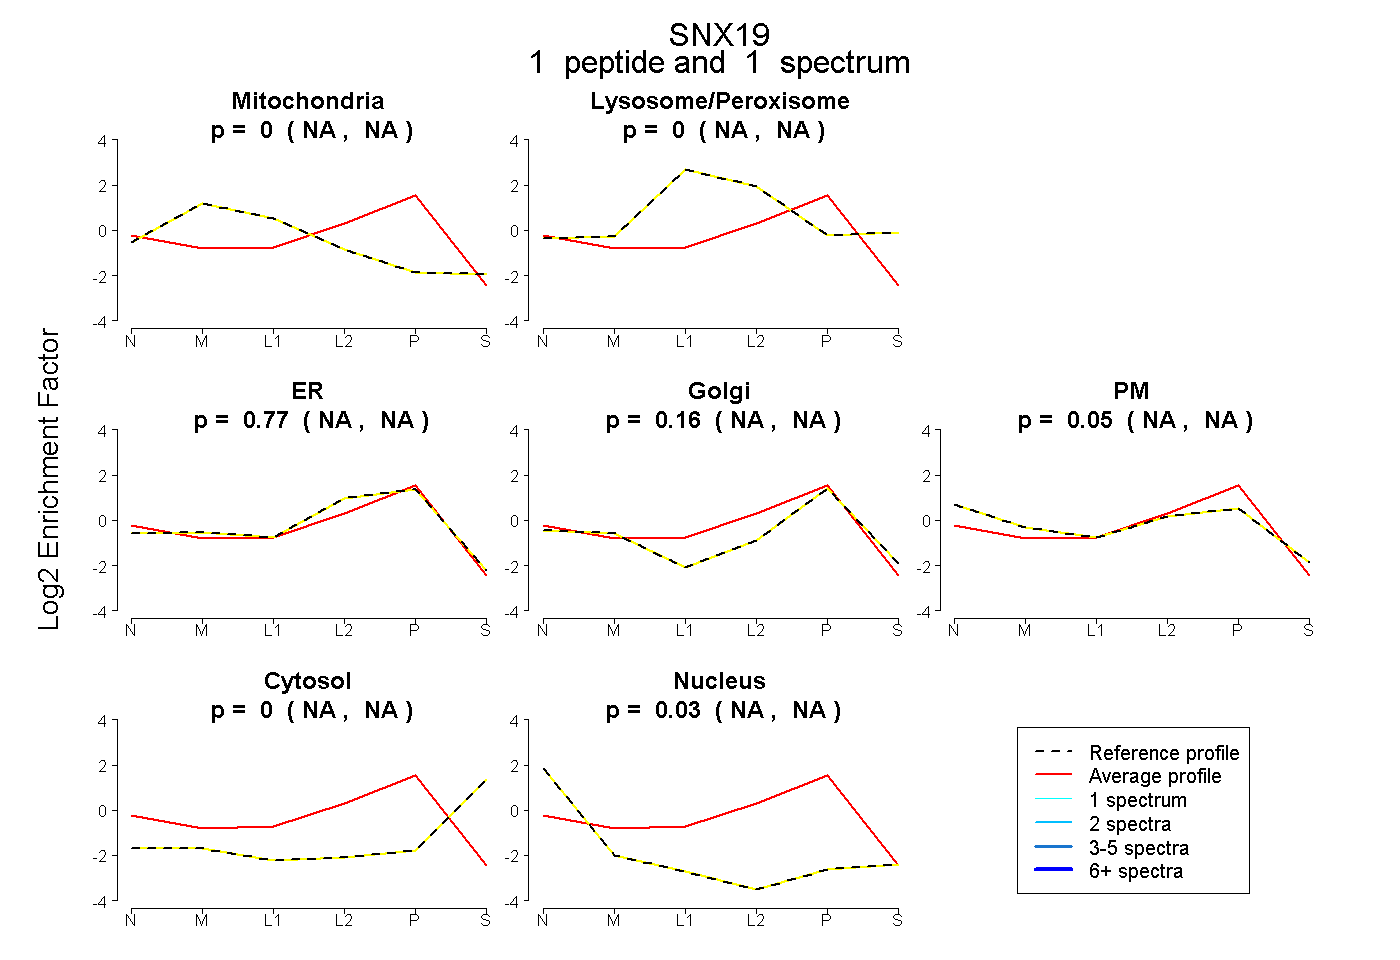 |
0.000 NA | NA |
0.000 NA | NA |
0.766 NA | NA |
0.156 NA | NA |
0.046 NA | NA |
0.000 NA | NA |
0.032 NA | NA |