5
5peptides
spectra
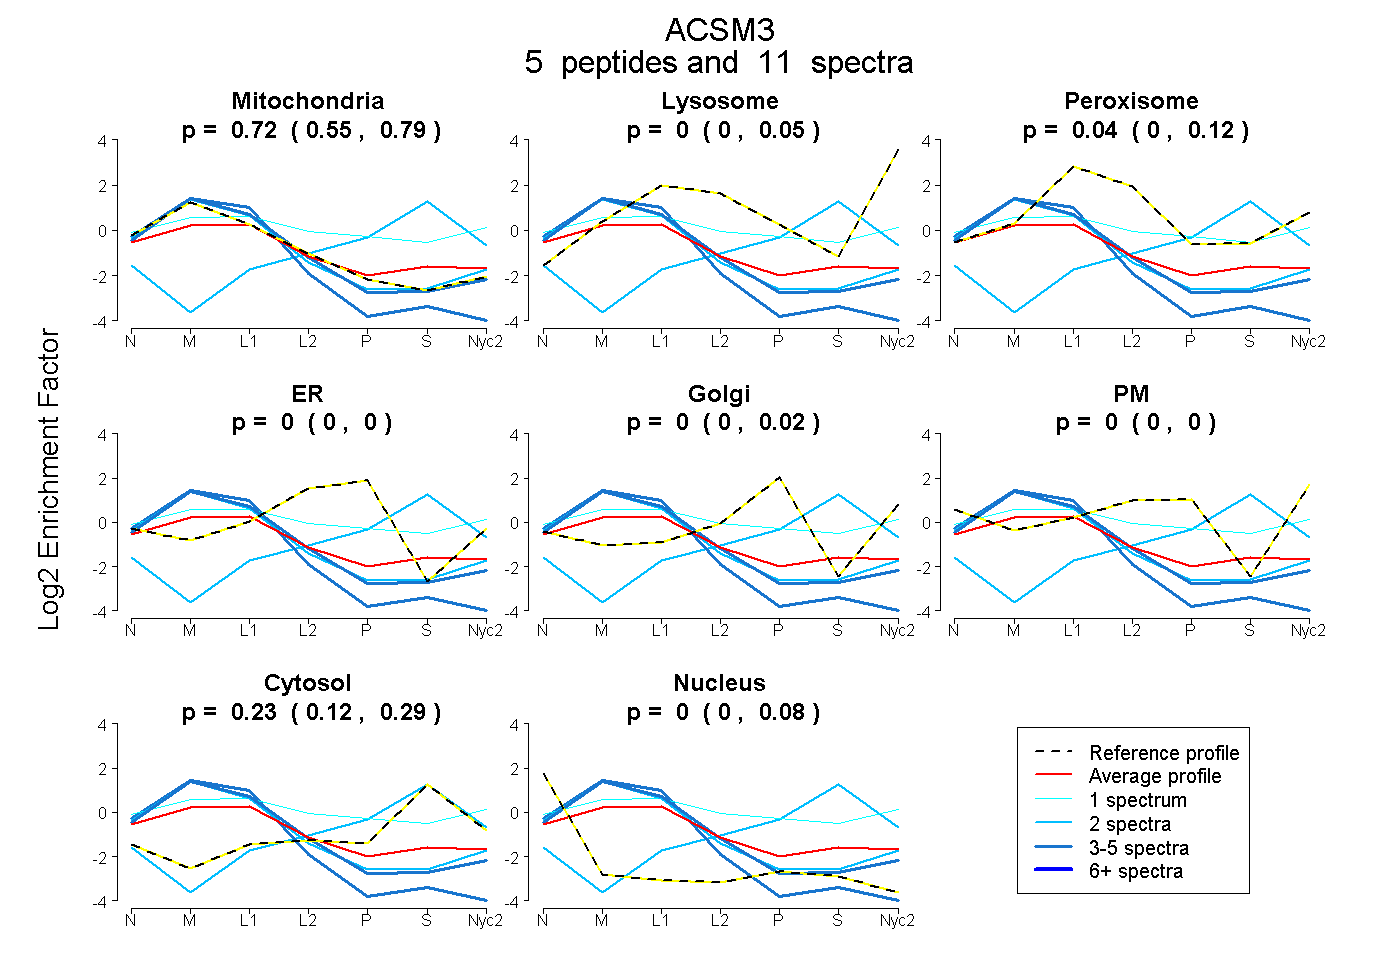
0.555 | 0.794
0.000 | 0.051
0.000 | 0.116
0.000 | 0.005
0.000 | 0.018
0.000 | 0.000
0.124 | 0.290
0.000 | 0.081
6peptides
spectra
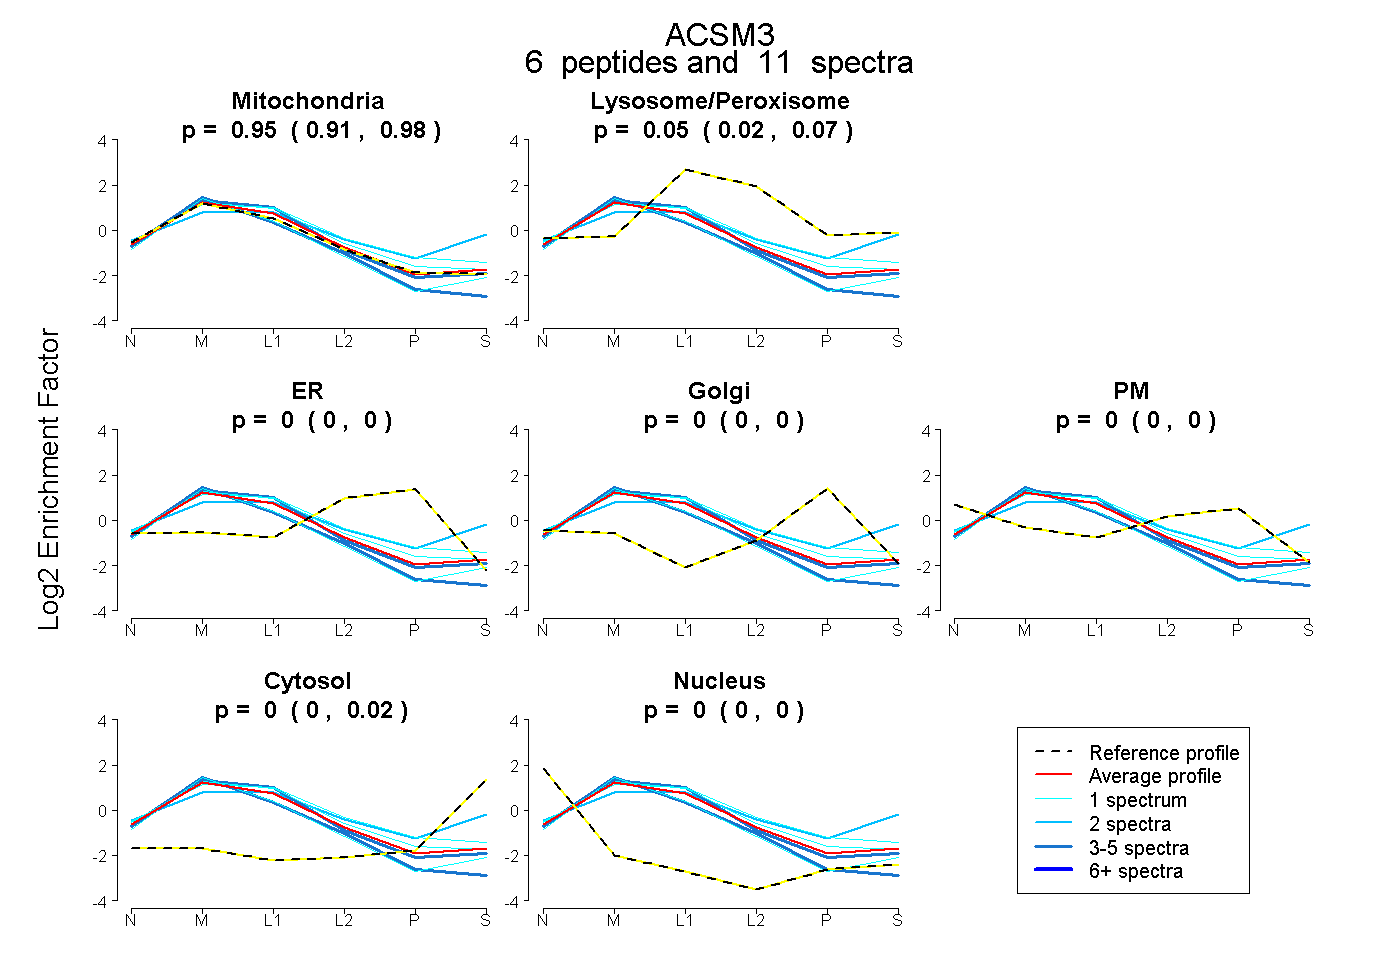
0.906 | 0.976
0.020 | 0.069
0.000 | 0.000
0.000 | 0.000
0.000 | 0.000
0.000 | 0.024
0.000 | 0.000
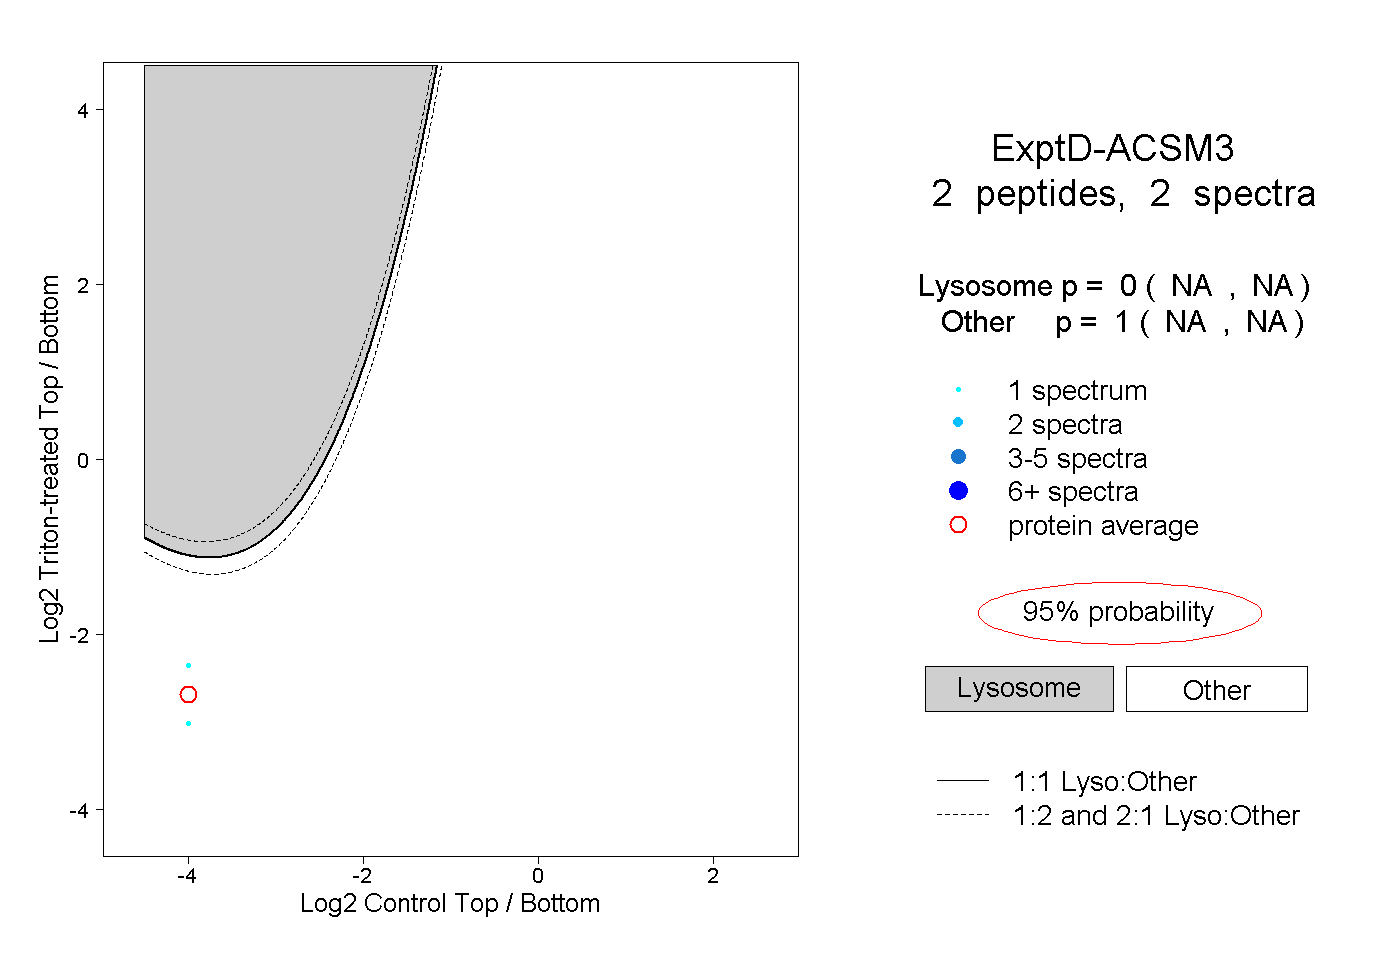
14peptides
spectra
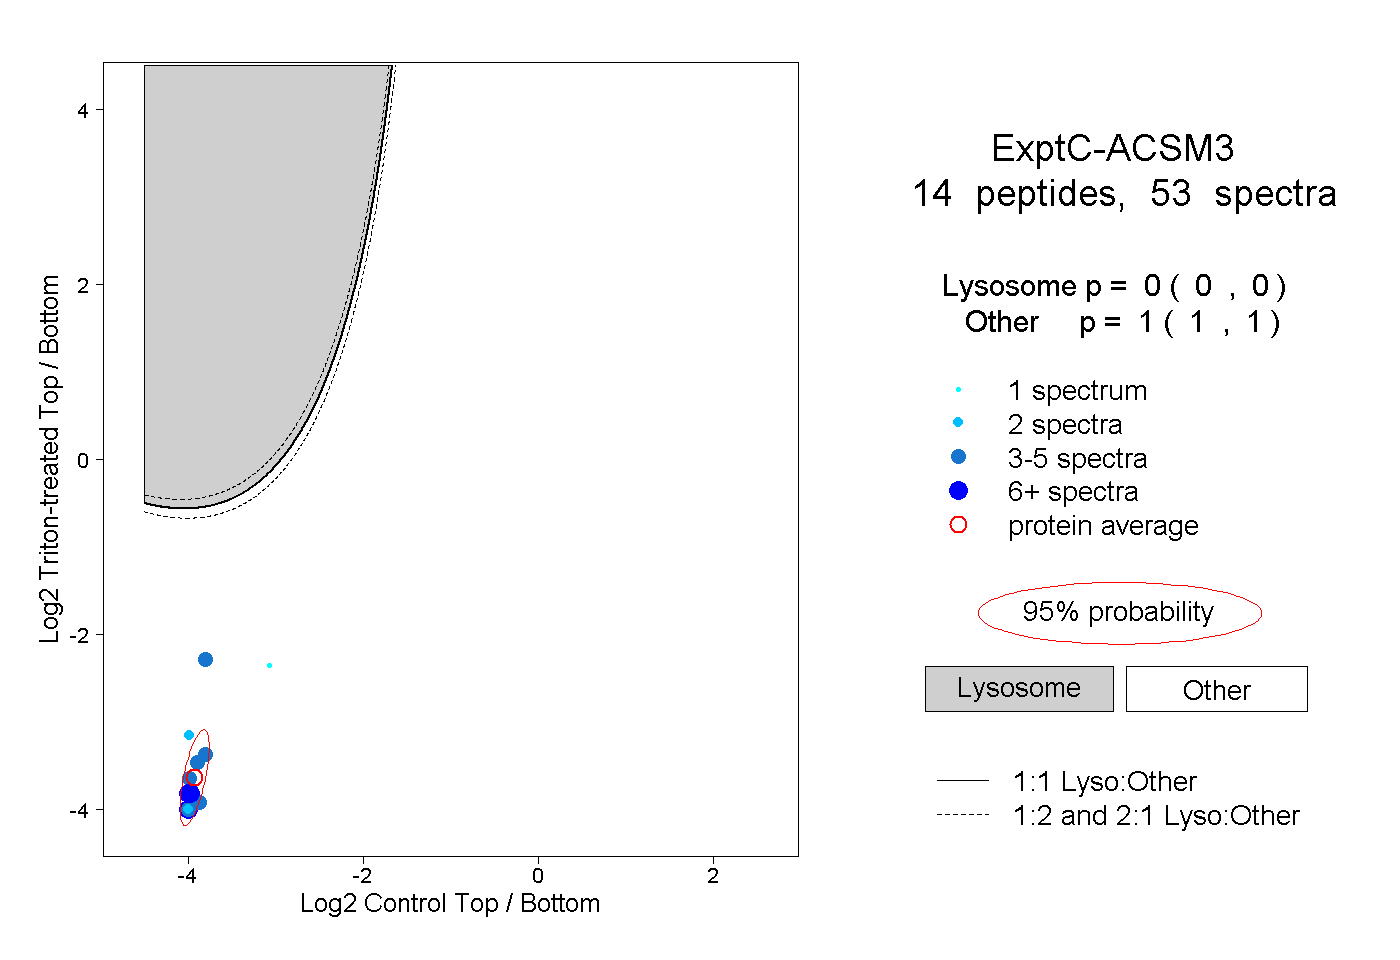
0.000 | 0.000
1.000 | 1.000