 5
5peptides
spectra
0.555 | 0.794
0.000 | 0.051
0.000 | 0.116
0.000 | 0.005
0.000 | 0.018
0.000 | 0.000
0.124 | 0.290
0.000 | 0.081
| Plot | Mito | Lyso | Perox | ER | Golgi | PM | Cytosol | Nucleus | |||||
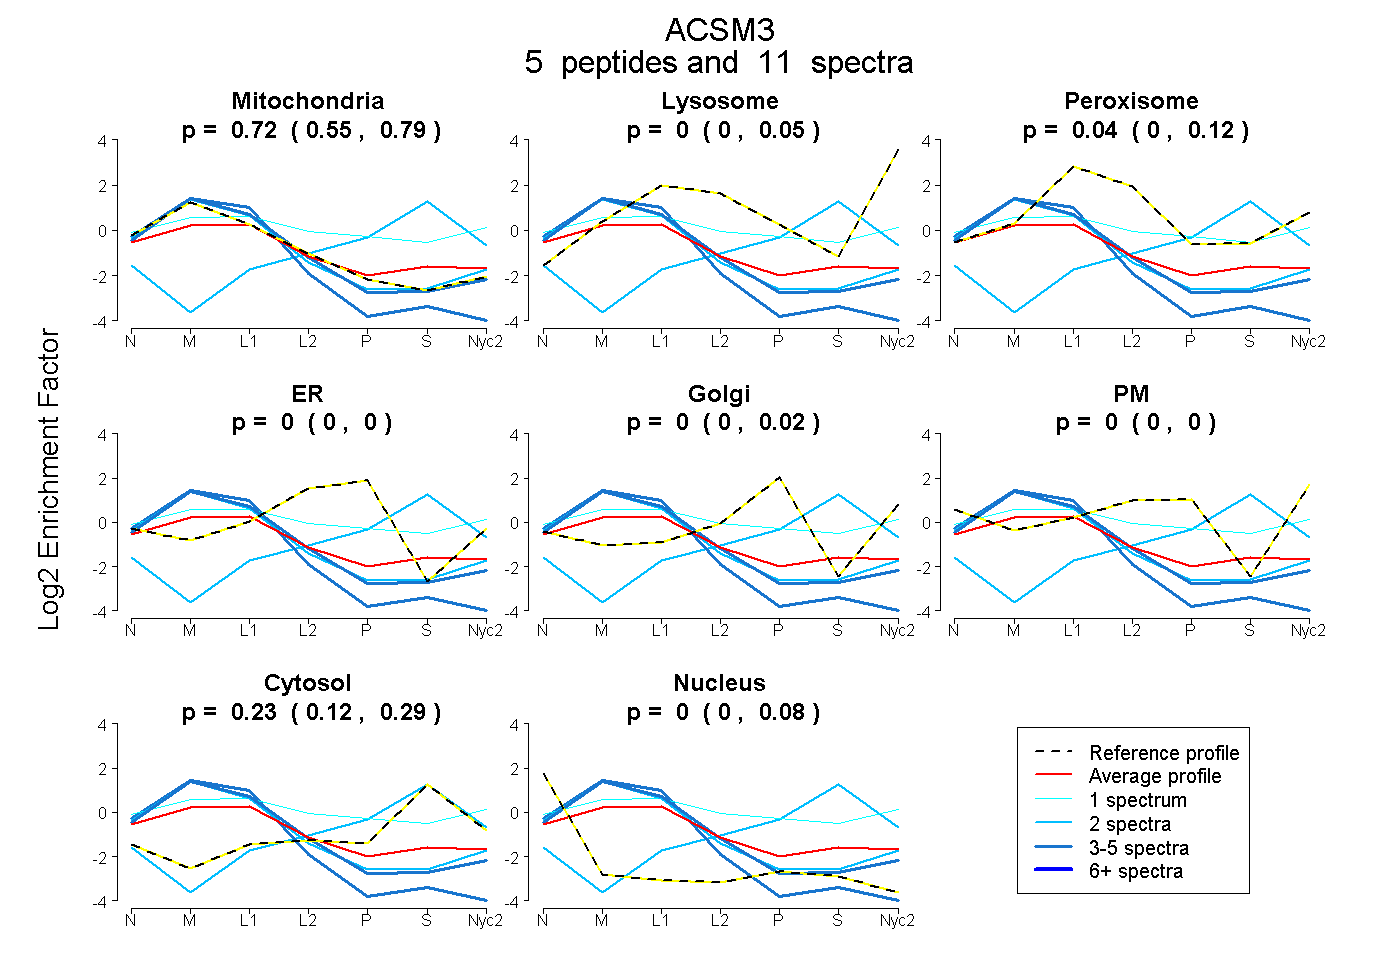
| Expt A |
5 peptides |
11 spectra |
|
0.721 0.555 | 0.794 |
0.000 0.000 | 0.051 |
0.045 0.000 | 0.116 |
0.000 0.000 | 0.005 |
0.000 0.000 | 0.018 |
0.000 0.000 | 0.000 |
0.235 0.124 | 0.290 |
0.000 0.000 | 0.081 |
| 3 spectra, WSFEELGSLSR | 1.000 | 0.000 | 0.000 | 0.000 | 0.000 | 0.000 | 0.000 | 0.000 | ||
| 1 spectrum, LIVSQHSR | 0.251 | 0.056 | 0.284 | 0.000 | 0.040 | 0.181 | 0.189 | 0.000 | ||
| 3 spectra, FPITVFCSAPTAYR | 0.930 | 0.000 | 0.000 | 0.000 | 0.000 | 0.000 | 0.000 | 0.070 | ||
| 2 spectra, AMLLR | 0.000 | 0.000 | 0.000 | 0.000 | 0.069 | 0.000 | 0.931 | 0.000 | ||
| 2 spectra, SDDVILSSGYR | 0.991 | 0.009 | 0.000 | 0.000 | 0.000 | 0.000 | 0.000 | 0.000 |
| Plot | Mito | Lyso or Perox | ER | Golgi | PM | Cytosol | Nucleus | ||||||
| Expt B |
6 peptides |
11 spectra |
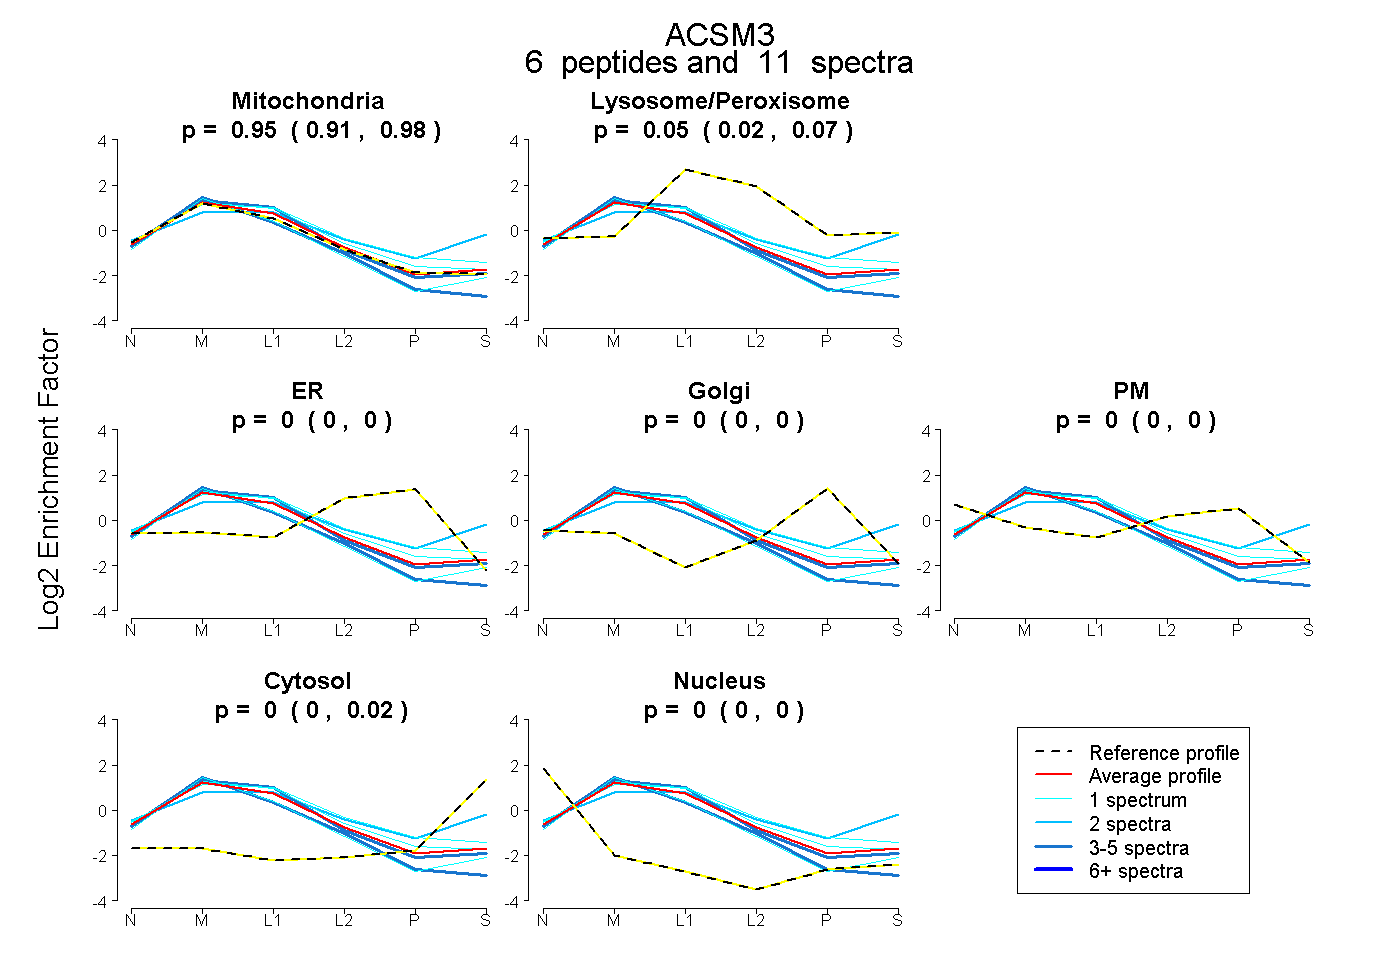 |
0.954 0.906 | 0.976 |
0.046 0.020 | 0.069 |
0.000 0.000 | 0.000 |
0.000 0.000 | 0.000 |
0.000 0.000 | 0.000 |
0.000 0.000 | 0.024 |
0.000 0.000 | 0.000 |
|||
| Plot | Lyso | Other | |||||||||||
| Expt C |
14 peptides |
53 spectra |
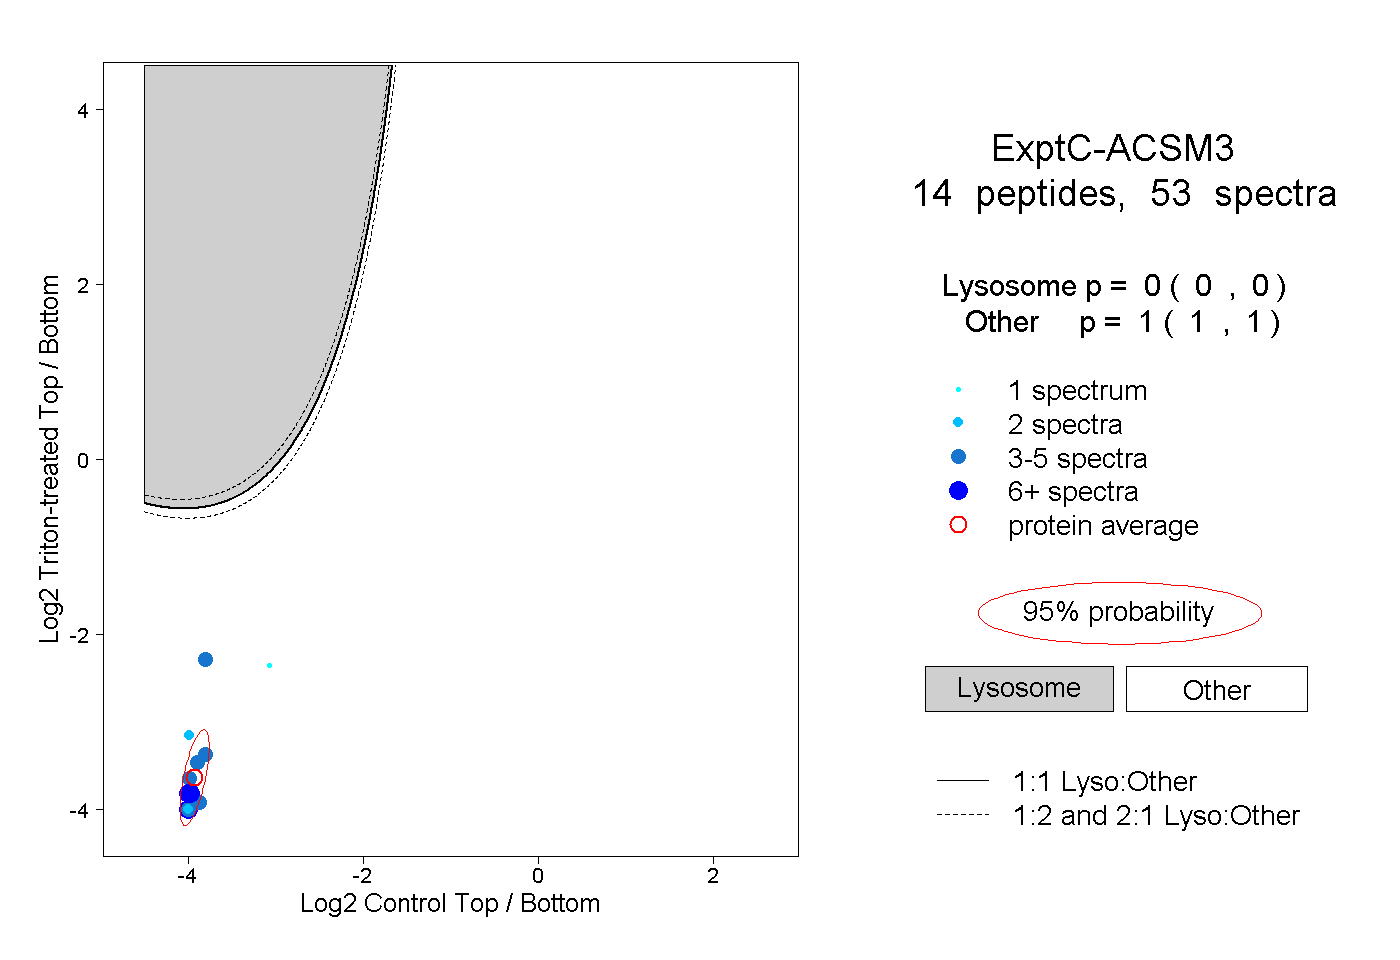 |
0.000 0.000 | 0.000 |
1.000 1.000 | 1.000 |
||||||||
| Plot | Lyso | Other | |||||||||||
| Expt D |
2 peptides |
2 spectra |
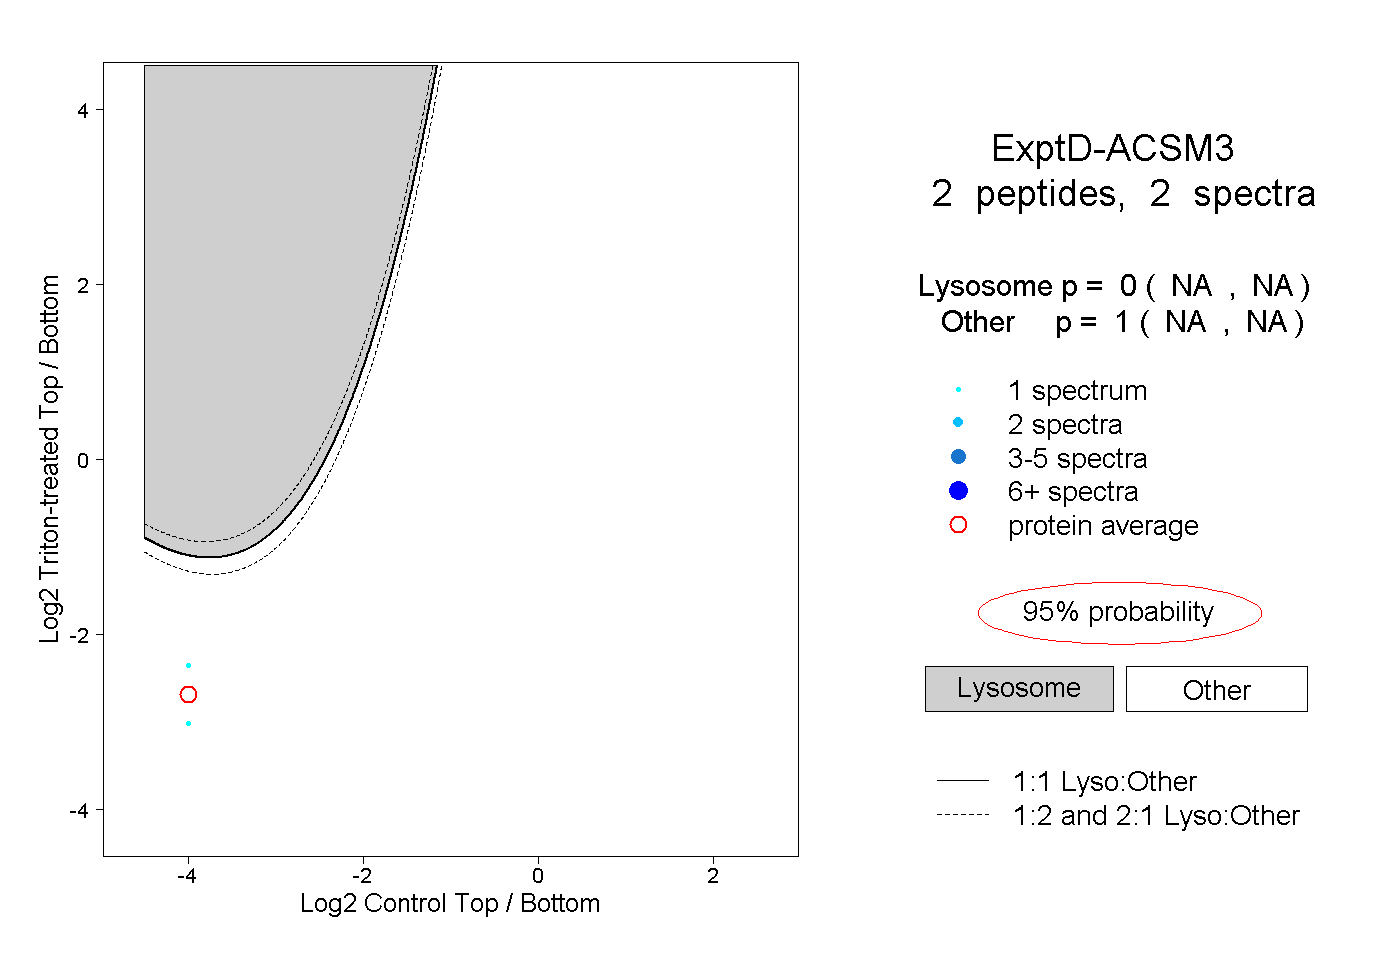 |
0.000 NA | NA |
1.000 NA | NA |