 4
4peptides
spectra
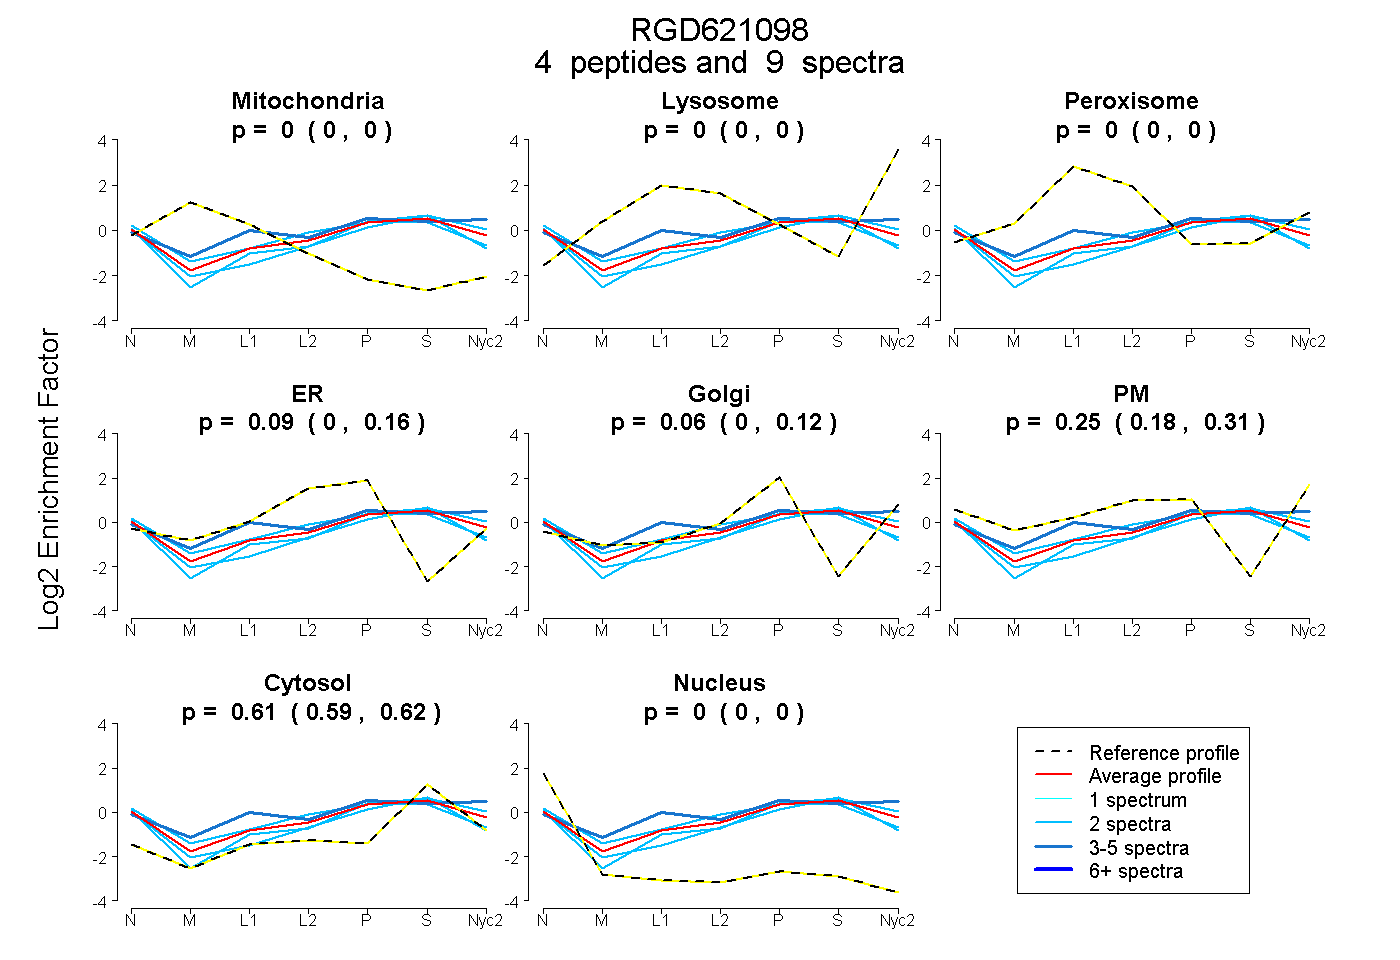
0.000 | 0.000
0.000 | 0.000
0.000 | 0.005
0.000 | 0.160
0.000 | 0.115
0.180 | 0.311
0.588 | 0.618
0.000 | 0.000
1peptide
spectra

NA | NA
NA | NA
NA | NA
NA | NA
NA | NA
NA | NA
NA | NA
3peptides
spectra
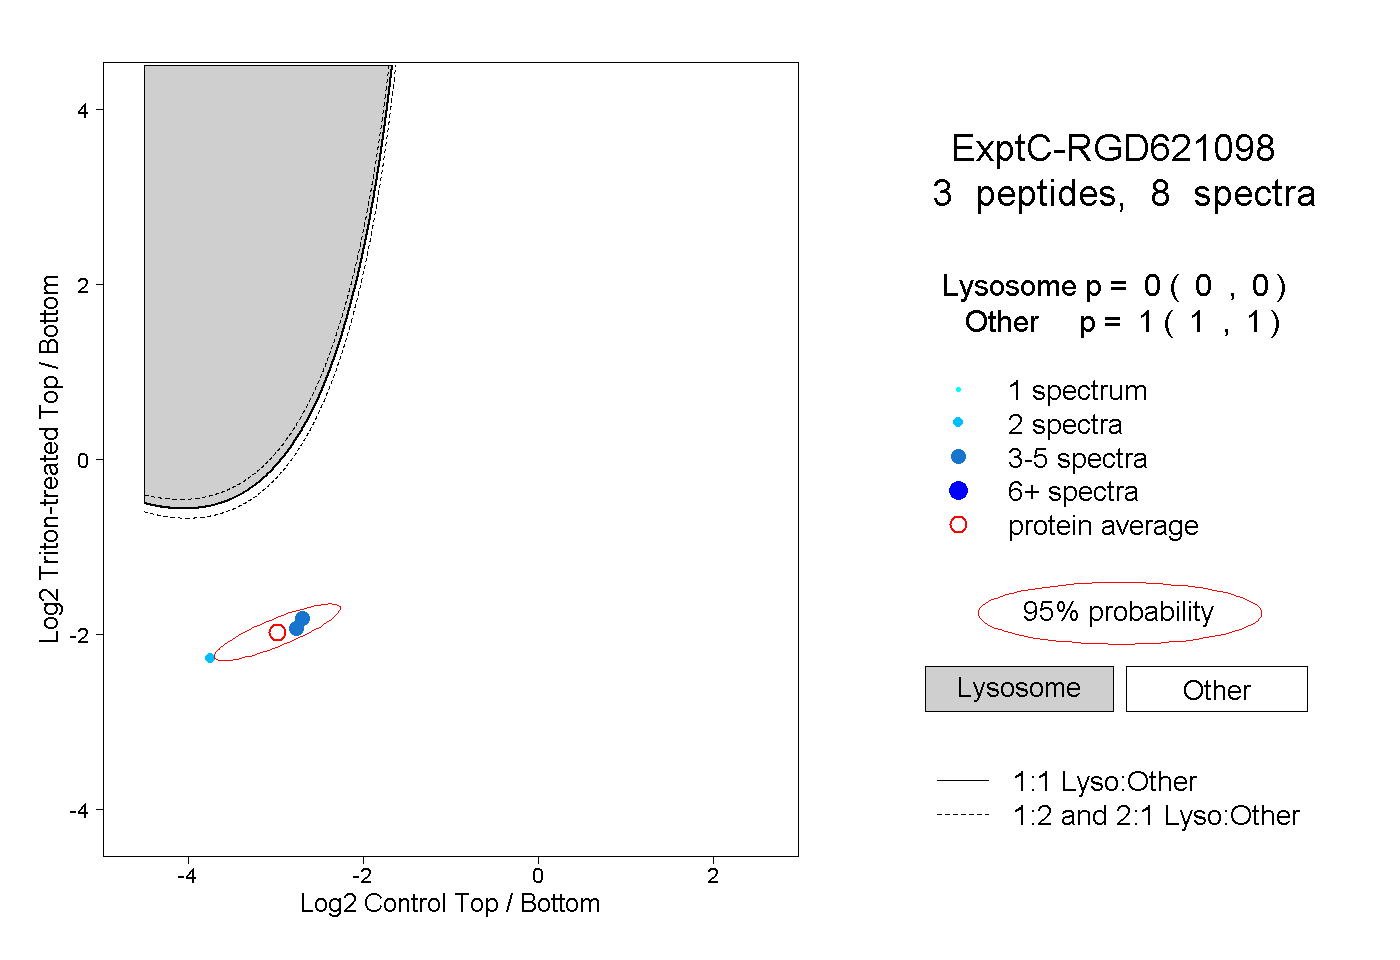
0.000 | 0.000
1.000 | 1.000