9
9peptides
spectra
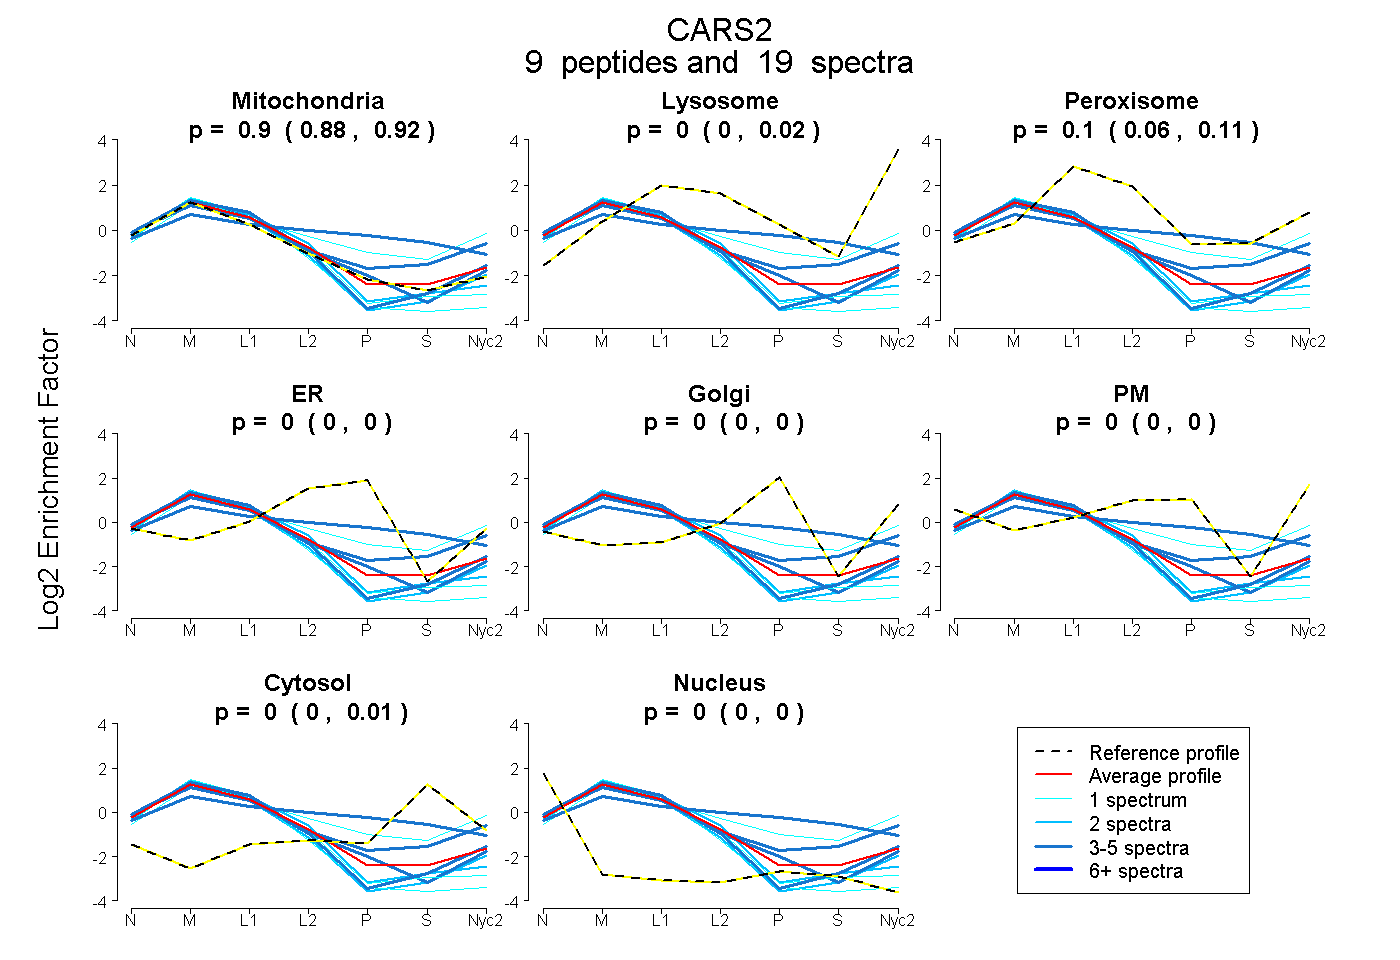
0.883 | 0.921
0.000 | 0.023
0.063 | 0.108
0.000 | 0.000
0.000 | 0.000
0.000 | 0.000
0.000 | 0.005
0.000 | 0.000
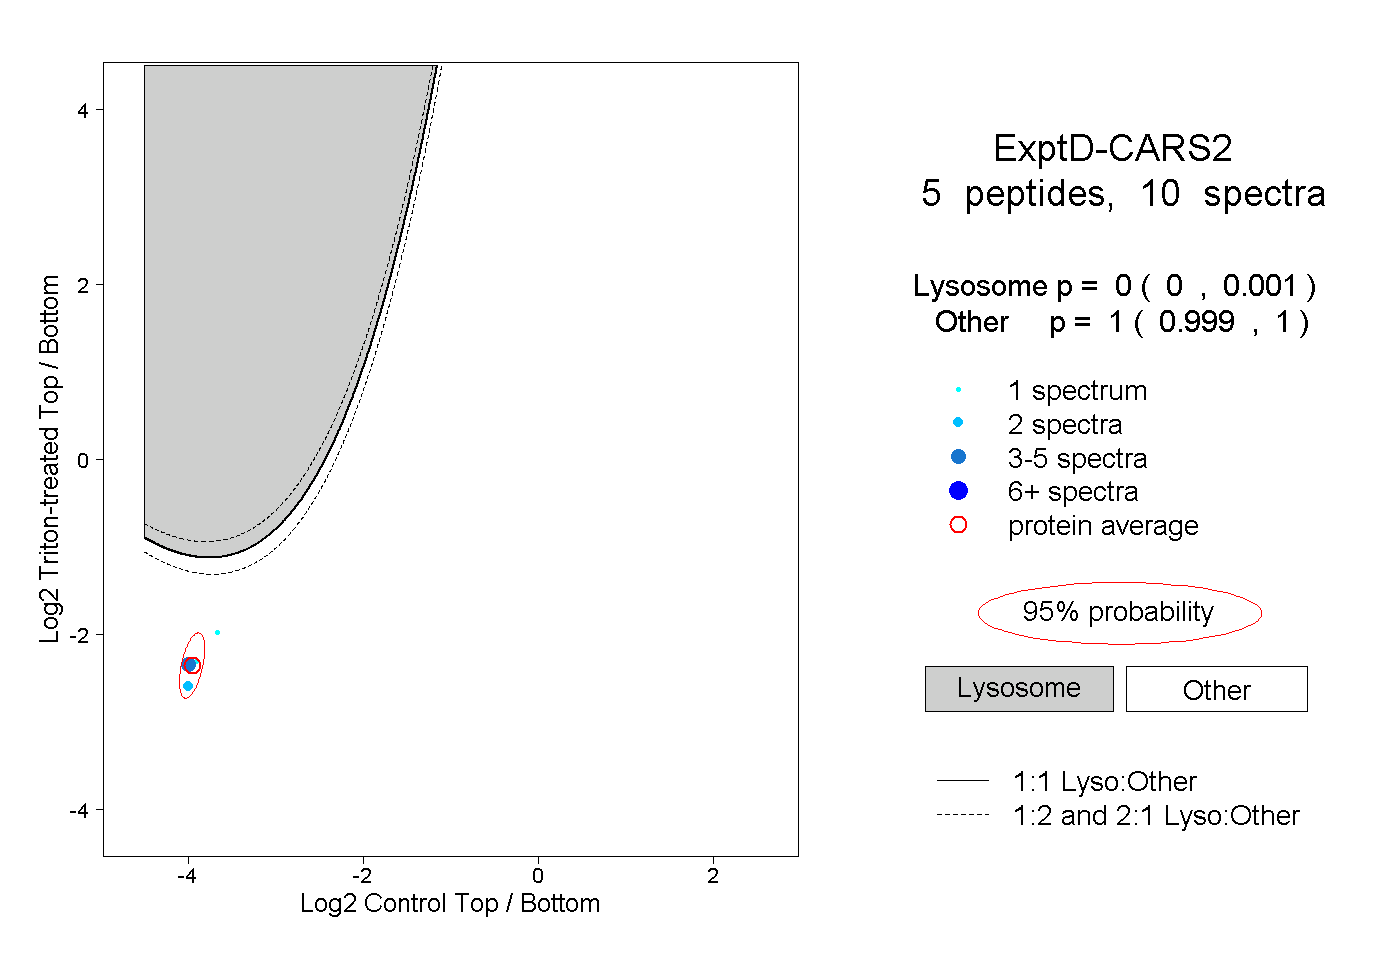
5peptides
spectra
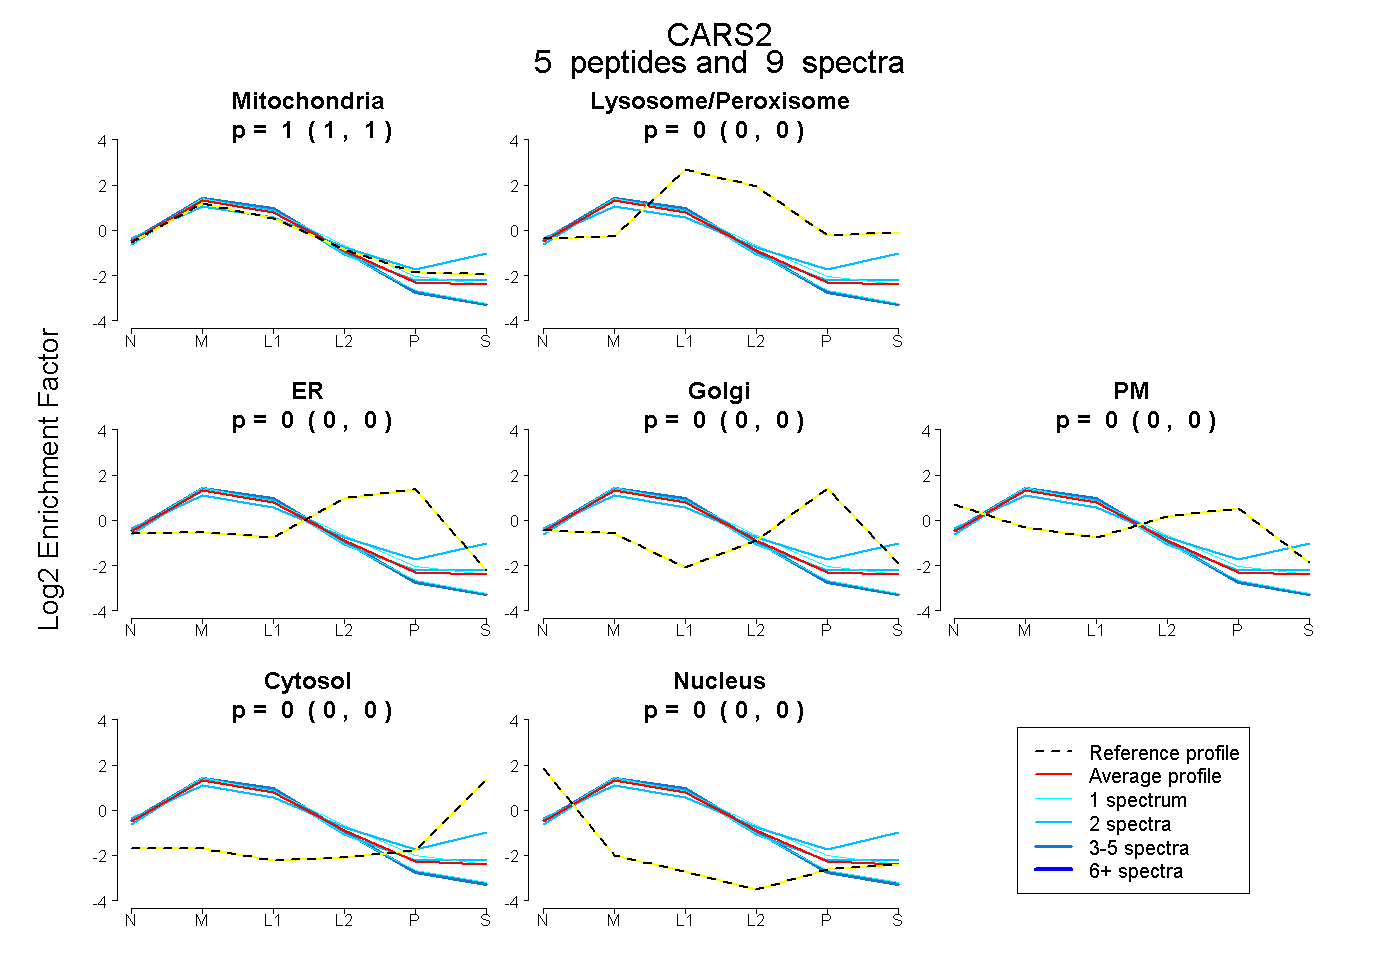
1.000 | 1.000
0.000 | 0.000
0.000 | 0.000
0.000 | 0.000
0.000 | 0.000
0.000 | 0.000
0.000 | 0.000
16peptides
spectra
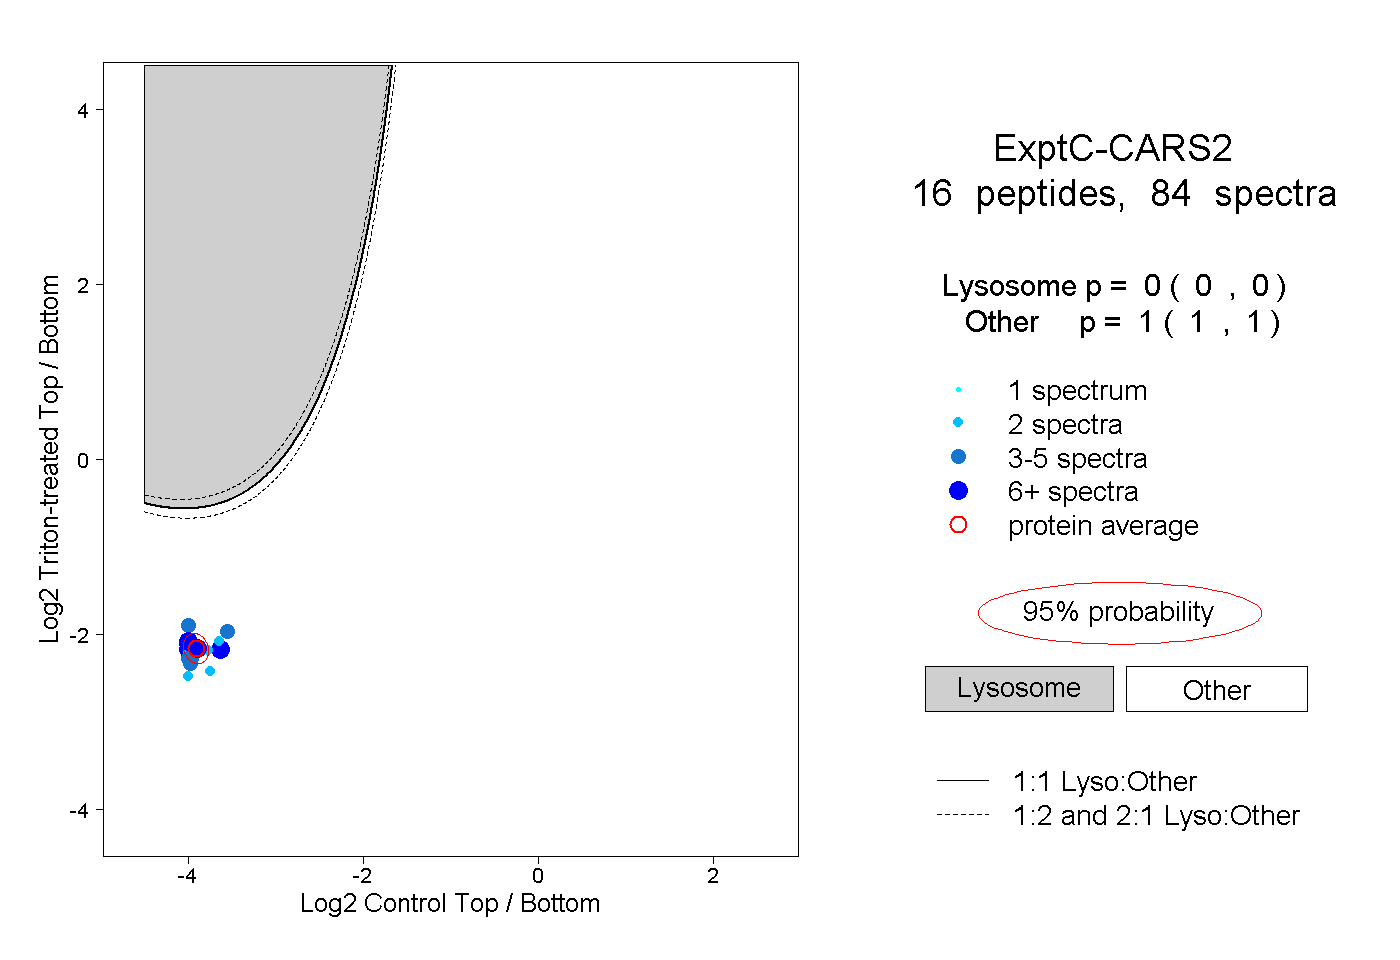
0.000 | 0.000
1.000 | 1.000