 9
9peptides
spectra
0.883 | 0.921
0.000 | 0.023
0.063 | 0.108
0.000 | 0.000
0.000 | 0.000
0.000 | 0.000
0.000 | 0.005
0.000 | 0.000
| Plot | Mito | Lyso | Perox | ER | Golgi | PM | Cytosol | Nucleus | |||||
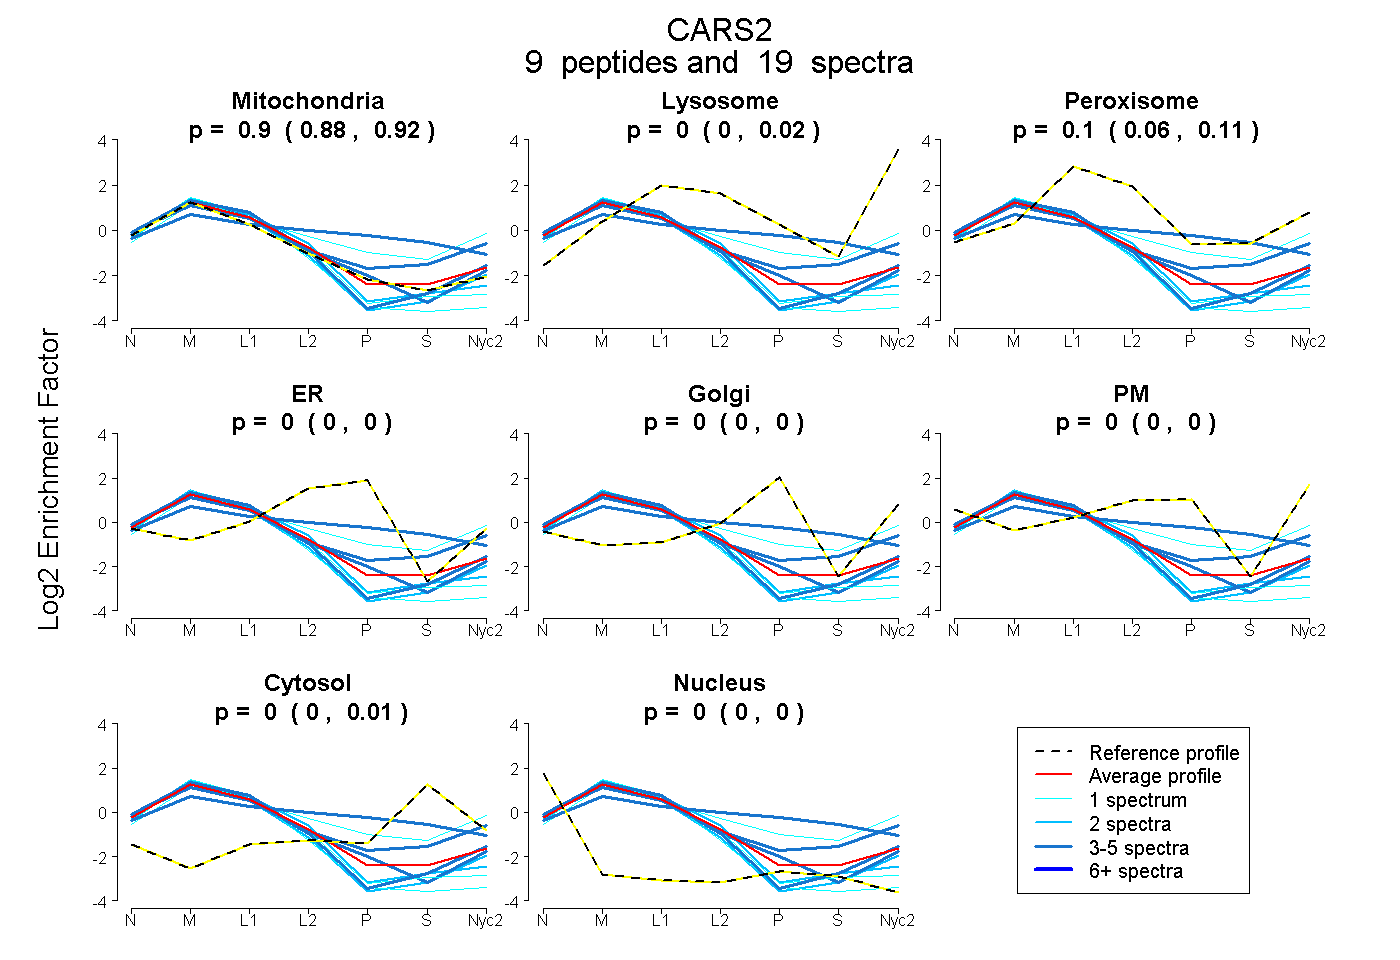
| Expt A |
9 peptides |
19 spectra |
|
0.904 0.883 | 0.921 |
0.000 0.000 | 0.023 |
0.096 0.063 | 0.108 |
0.000 0.000 | 0.000 |
0.000 0.000 | 0.000 |
0.000 0.000 | 0.000 |
0.000 0.000 | 0.005 |
0.000 0.000 | 0.000 |
| 1 spectrum, GQLICGPVGEDVLWER | 0.983 | 0.000 | 0.000 | 0.000 | 0.000 | 0.000 | 0.000 | 0.017 | ||
| 3 spectra, QDLMTHGINVK | 0.359 | 0.000 | 0.249 | 0.150 | 0.037 | 0.000 | 0.205 | 0.000 | ||
| 2 spectra, DFLQTFSPDVFR | 1.000 | 0.000 | 0.000 | 0.000 | 0.000 | 0.000 | 0.000 | 0.000 | ||
| 3 spectra, VLPPTVYLR | 0.704 | 0.179 | 0.026 | 0.000 | 0.000 | 0.000 | 0.092 | 0.000 | ||
| 2 spectra, AVNSILDLVHHANR | 1.000 | 0.000 | 0.000 | 0.000 | 0.000 | 0.000 | 0.000 | 0.000 | ||
| 3 spectra, SAIDYSDSTLEEAR | 0.980 | 0.000 | 0.020 | 0.000 | 0.000 | 0.000 | 0.000 | 0.000 | ||
| 3 spectra, EPLIVGR | 0.947 | 0.000 | 0.000 | 0.000 | 0.000 | 0.053 | 0.000 | 0.000 | ||
| 1 spectrum, QPLLEACDALR | 0.999 | 0.000 | 0.000 | 0.000 | 0.000 | 0.000 | 0.000 | 0.001 | ||
| 1 spectrum, HLLLGLASFVEDAR | 0.563 | 0.292 | 0.035 | 0.000 | 0.014 | 0.000 | 0.095 | 0.000 |
| Plot | Mito | Lyso or Perox | ER | Golgi | PM | Cytosol | Nucleus | ||||||
| Expt B |
5 peptides |
9 spectra |
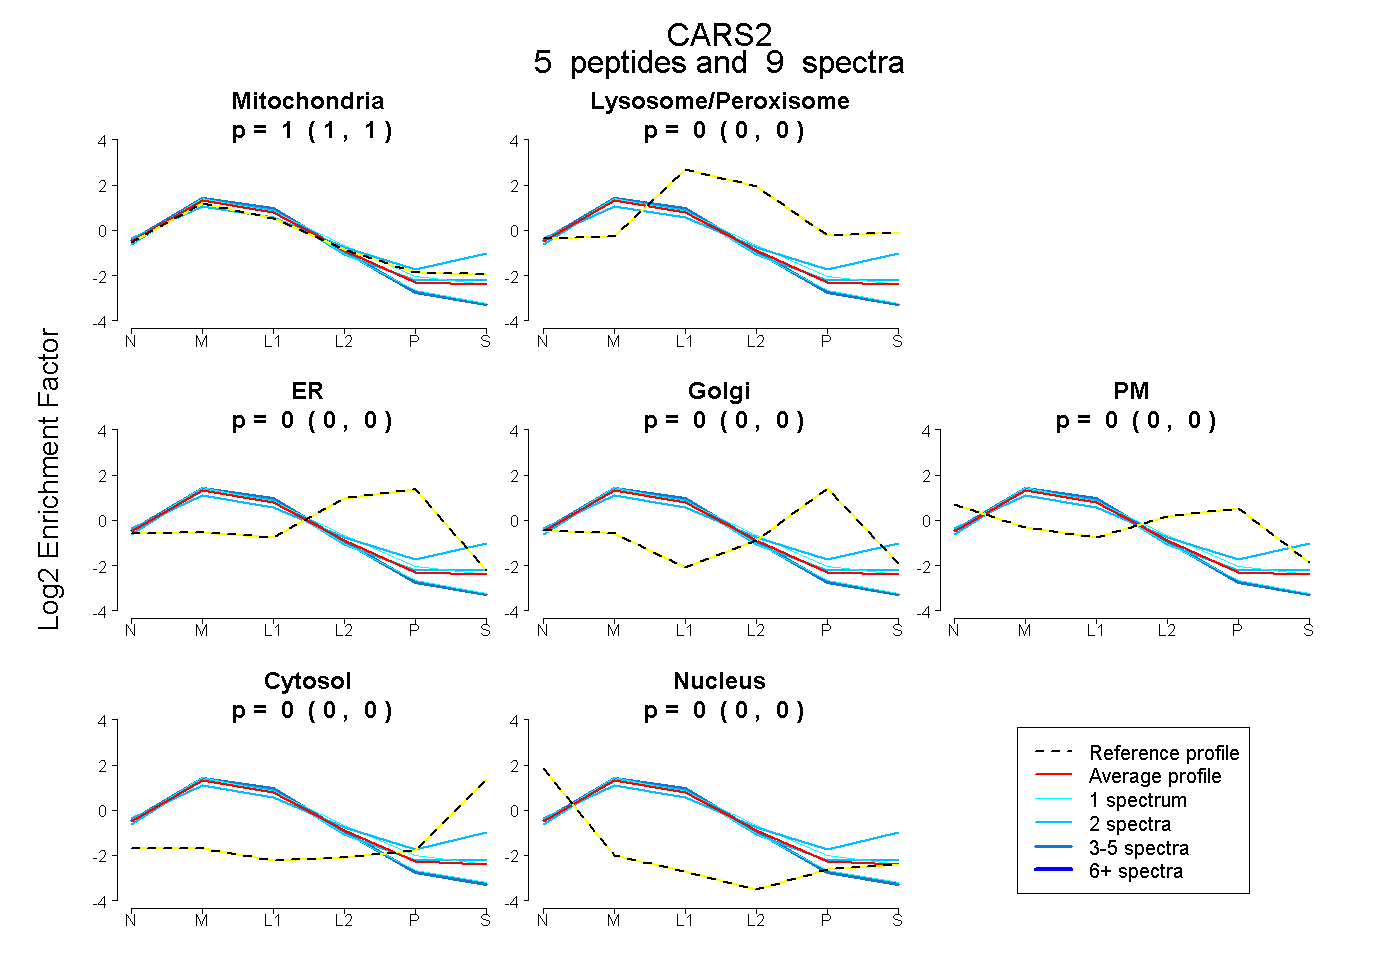 |
1.000 1.000 | 1.000 |
0.000 0.000 | 0.000 |
0.000 0.000 | 0.000 |
0.000 0.000 | 0.000 |
0.000 0.000 | 0.000 |
0.000 0.000 | 0.000 |
0.000 0.000 | 0.000 |
|||
| Plot | Lyso | Other | |||||||||||
| Expt C |
16 peptides |
84 spectra |
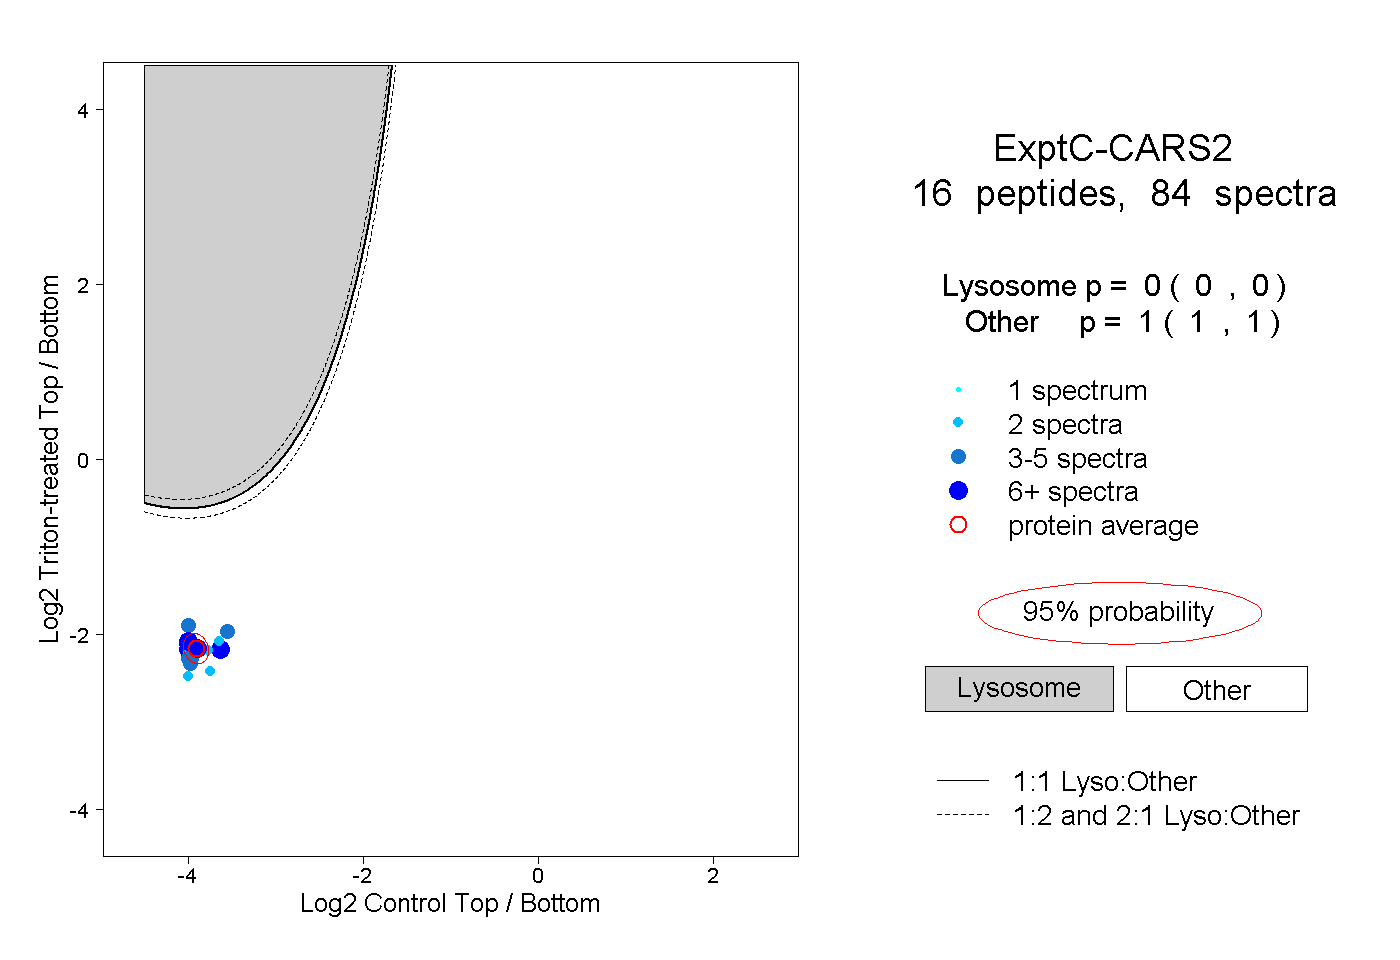 |
0.000 0.000 | 0.000 |
1.000 1.000 | 1.000 |
||||||||
| Plot | Lyso | Other | |||||||||||
| Expt D |
5 peptides |
10 spectra |
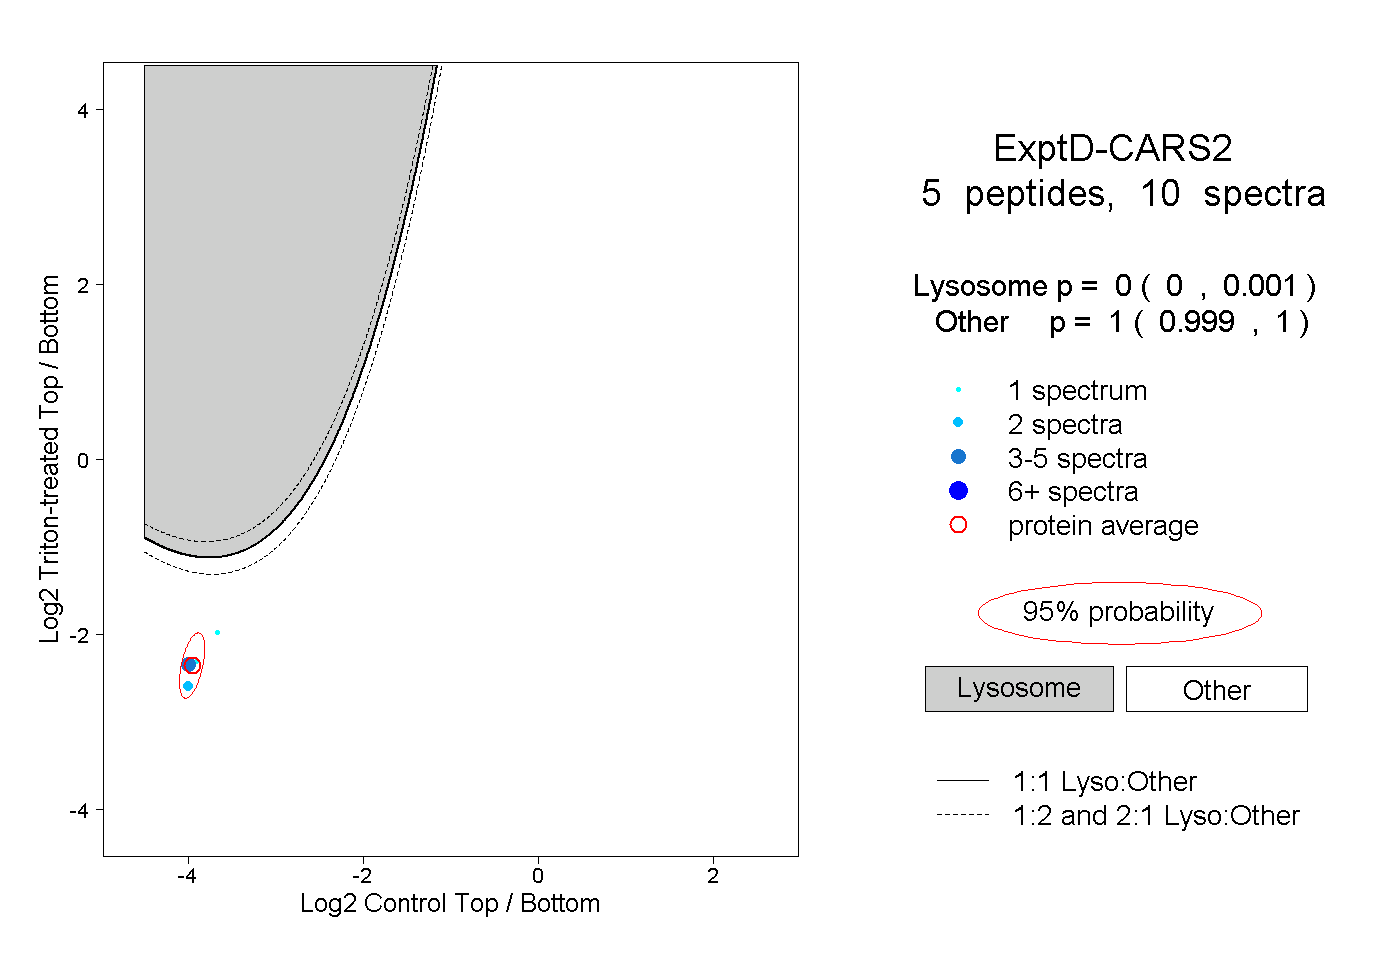 |
0.000 0.000 | 0.001 |
1.000 0.999 | 1.000 |