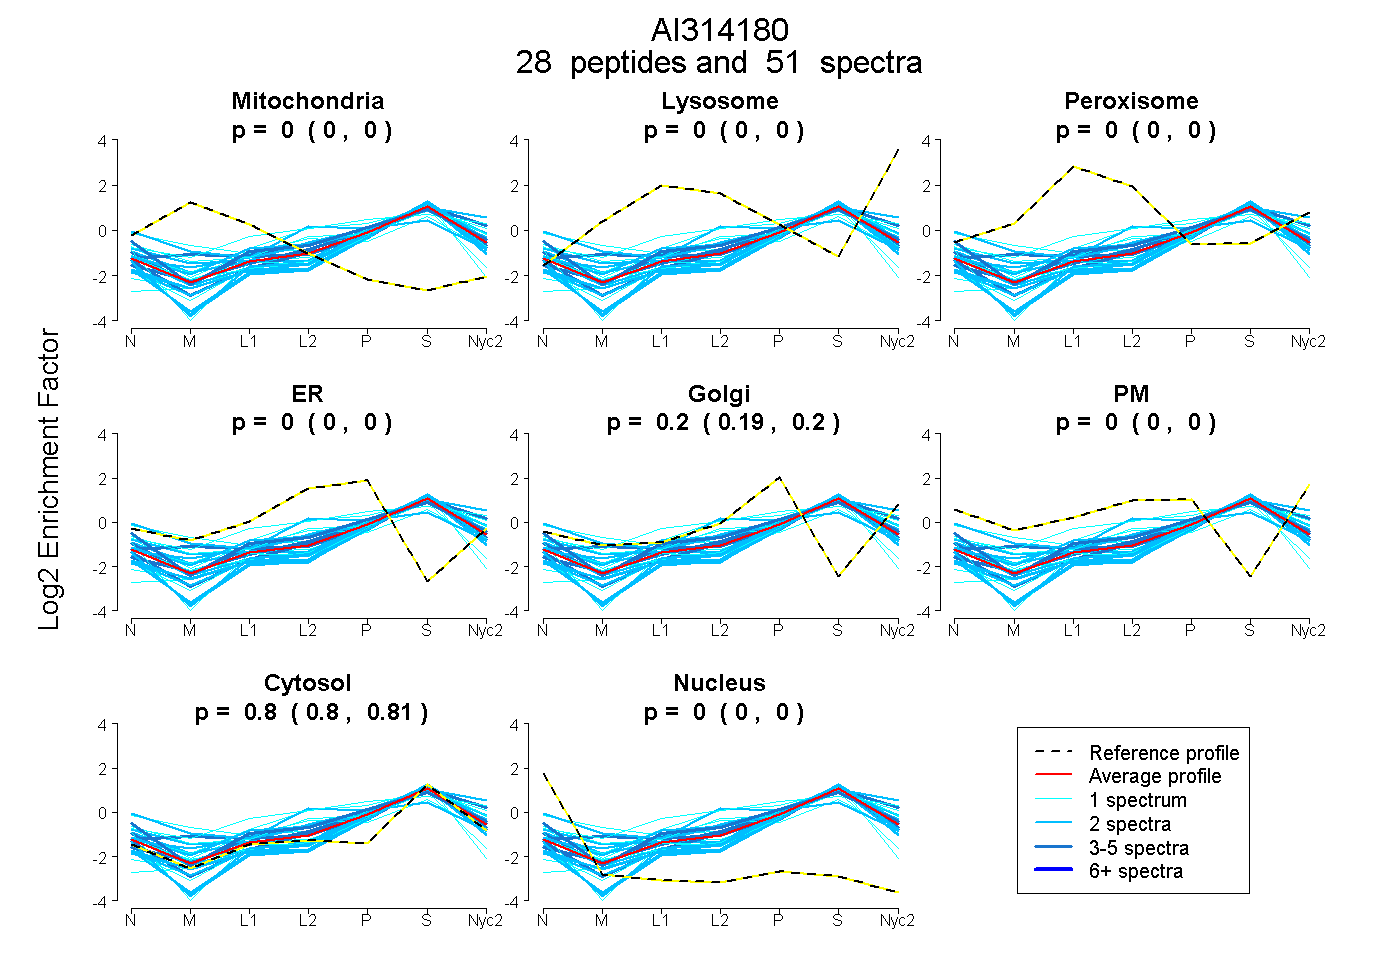
 28
28peptides
spectra
0.000 | 0.000
0.000 | 0.000
0.000 | 0.000
0.000 | 0.000
0.194 | 0.200
0.000 | 0.000
0.800 | 0.806
0.000 | 0.000
| Plot | Mito | Lyso | Perox | ER | Golgi | PM | Cytosol | Nucleus | |||||
| Expt A |
28 peptides |
51 spectra |
|
0.000 0.000 | 0.000 |
0.000 0.000 | 0.000 |
0.000 0.000 | 0.000 |
0.000 0.000 | 0.000 |
0.197 0.194 | 0.200 |
0.000 0.000 | 0.000 |
0.803 0.800 | 0.806 |
0.000 0.000 | 0.000 |
| 1 spectrum, HIISPNPHVR | 0.143 | 0.000 | 0.048 | 0.082 | 0.000 | 0.134 | 0.594 | 0.000 | ||
| 4 spectra, EEVHGEAQR | 0.000 | 0.000 | 0.000 | 0.000 | 0.118 | 0.000 | 0.882 | 0.000 | ||
| 2 spectra, AGEQLAPFLPQLVPR | 0.000 | 0.000 | 0.000 | 0.000 | 0.012 | 0.000 | 0.966 | 0.022 | ||
| 1 spectrum, AIACVVTASSTELEK | 0.000 | 0.000 | 0.000 | 0.218 | 0.000 | 0.000 | 0.762 | 0.019 | ||
| 2 spectra, SCAFAMGHLVR | 0.030 | 0.000 | 0.025 | 0.312 | 0.000 | 0.065 | 0.568 | 0.000 | ||
| 1 spectrum, EILQDLIK | 0.000 | 0.000 | 0.000 | 0.000 | 0.044 | 0.000 | 0.956 | 0.000 | ||
| 1 spectrum, QAMTSIWNALVTDK | 0.000 | 0.111 | 0.000 | 0.230 | 0.000 | 0.000 | 0.659 | 0.000 | ||
| 2 spectra, LHLVESLLNR | 0.000 | 0.000 | 0.058 | 0.011 | 0.264 | 0.000 | 0.667 | 0.000 | ||
| 1 spectrum, SGVGLGTK | 0.000 | 0.000 | 0.000 | 0.000 | 0.143 | 0.000 | 0.857 | 0.000 | ||
| 3 spectra, EEPIYK | 0.000 | 0.097 | 0.000 | 0.000 | 0.161 | 0.000 | 0.741 | 0.000 | ||
| 2 spectra, YPAESSK | 0.000 | 0.180 | 0.000 | 0.000 | 0.148 | 0.000 | 0.672 | 0.000 | ||
| 1 spectrum, VYLGDIPLK | 0.000 | 0.045 | 0.000 | 0.000 | 0.006 | 0.265 | 0.684 | 0.000 | ||
| 1 spectrum, DIALVQQLFEALCK | 0.000 | 0.000 | 0.000 | 0.011 | 0.000 | 0.000 | 0.973 | 0.016 | ||
| 2 spectra, TEALSVIELLLK | 0.000 | 0.095 | 0.000 | 0.000 | 0.179 | 0.000 | 0.726 | 0.000 | ||
| 3 spectra, MPHLFTK | 0.037 | 0.039 | 0.028 | 0.000 | 0.183 | 0.000 | 0.713 | 0.000 | ||
| 3 spectra, FLPPVLLK | 0.000 | 0.000 | 0.000 | 0.044 | 0.134 | 0.000 | 0.822 | 0.000 | ||
| 2 spectra, IVPHLLR | 0.000 | 0.000 | 0.000 | 0.000 | 0.103 | 0.000 | 0.897 | 0.000 | ||
| 1 spectrum, TSCALTIHAIGR | 0.000 | 0.090 | 0.186 | 0.000 | 0.246 | 0.000 | 0.479 | 0.000 | ||
| 2 spectra, GMMSPVTEVR | 0.000 | 0.000 | 0.000 | 0.000 | 0.174 | 0.000 | 0.826 | 0.000 | ||
| 2 spectra, YQFDPNLGIR | 0.000 | 0.000 | 0.000 | 0.000 | 0.077 | 0.000 | 0.923 | 0.000 | ||
| 2 spectra, VMELLVHLNK | 0.000 | 0.000 | 0.000 | 0.000 | 0.127 | 0.000 | 0.873 | 0.000 | ||
| 2 spectra, ALSINTLVK | 0.000 | 0.000 | 0.000 | 0.000 | 0.208 | 0.000 | 0.792 | 0.000 | ||
| 2 spectra, GAAFGFNVIATR | 0.000 | 0.000 | 0.000 | 0.000 | 0.059 | 0.000 | 0.941 | 0.000 | ||
| 1 spectrum, TLMSSSQATASSCNK | 0.000 | 0.000 | 0.000 | 0.000 | 0.142 | 0.000 | 0.858 | 0.000 | ||
| 1 spectrum, LSSTQEGVR | 0.000 | 0.000 | 0.000 | 0.000 | 0.179 | 0.000 | 0.821 | 0.000 | ||
| 1 spectrum, AQGAIAMASIAK | 0.000 | 0.053 | 0.000 | 0.000 | 0.036 | 0.000 | 0.911 | 0.000 | ||
| 2 spectra, TPDGQGLSTYK | 0.000 | 0.000 | 0.000 | 0.000 | 0.087 | 0.000 | 0.913 | 0.000 | ||
| 3 spectra, YSPDVLK | 0.000 | 0.000 | 0.000 | 0.097 | 0.126 | 0.051 | 0.726 | 0.000 |
| Plot | Mito | Lyso or Perox | ER | Golgi | PM | Cytosol | Nucleus | ||||||
| Expt B |
3 peptides |
4 spectra |
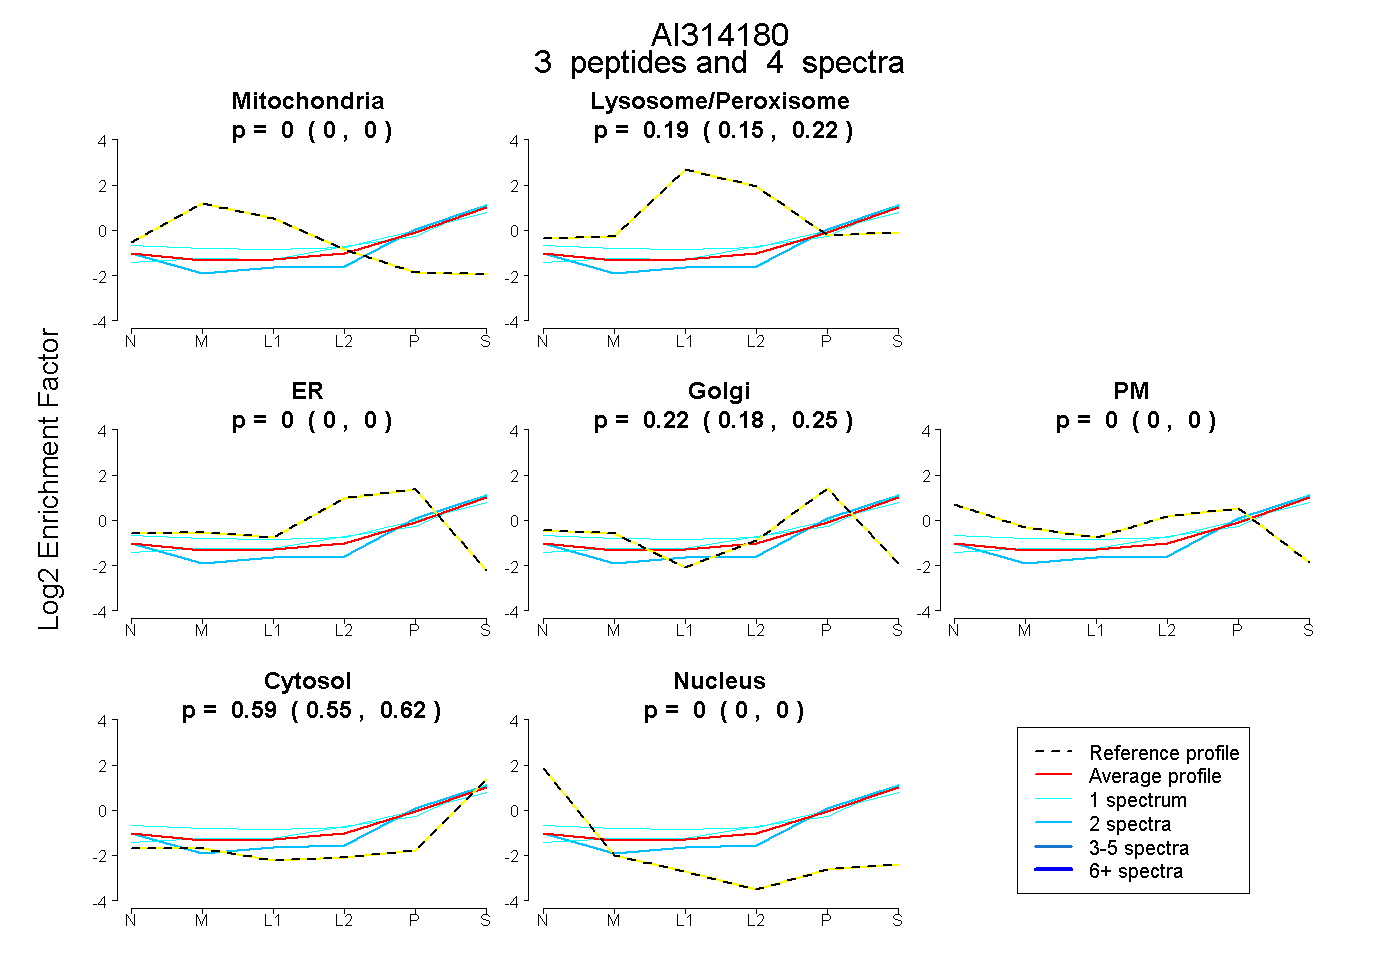 |
0.000 0.000 | 0.000 |
0.191 0.151 | 0.224 |
0.000 0.000 | 0.000 |
0.224 0.183 | 0.252 |
0.000 0.000 | 0.000 |
0.585 0.549 | 0.615 |
0.000 0.000 | 0.000 |
|||
| Plot | Lyso | Other | |||||||||||
| Expt C |
9 peptides |
18 spectra |
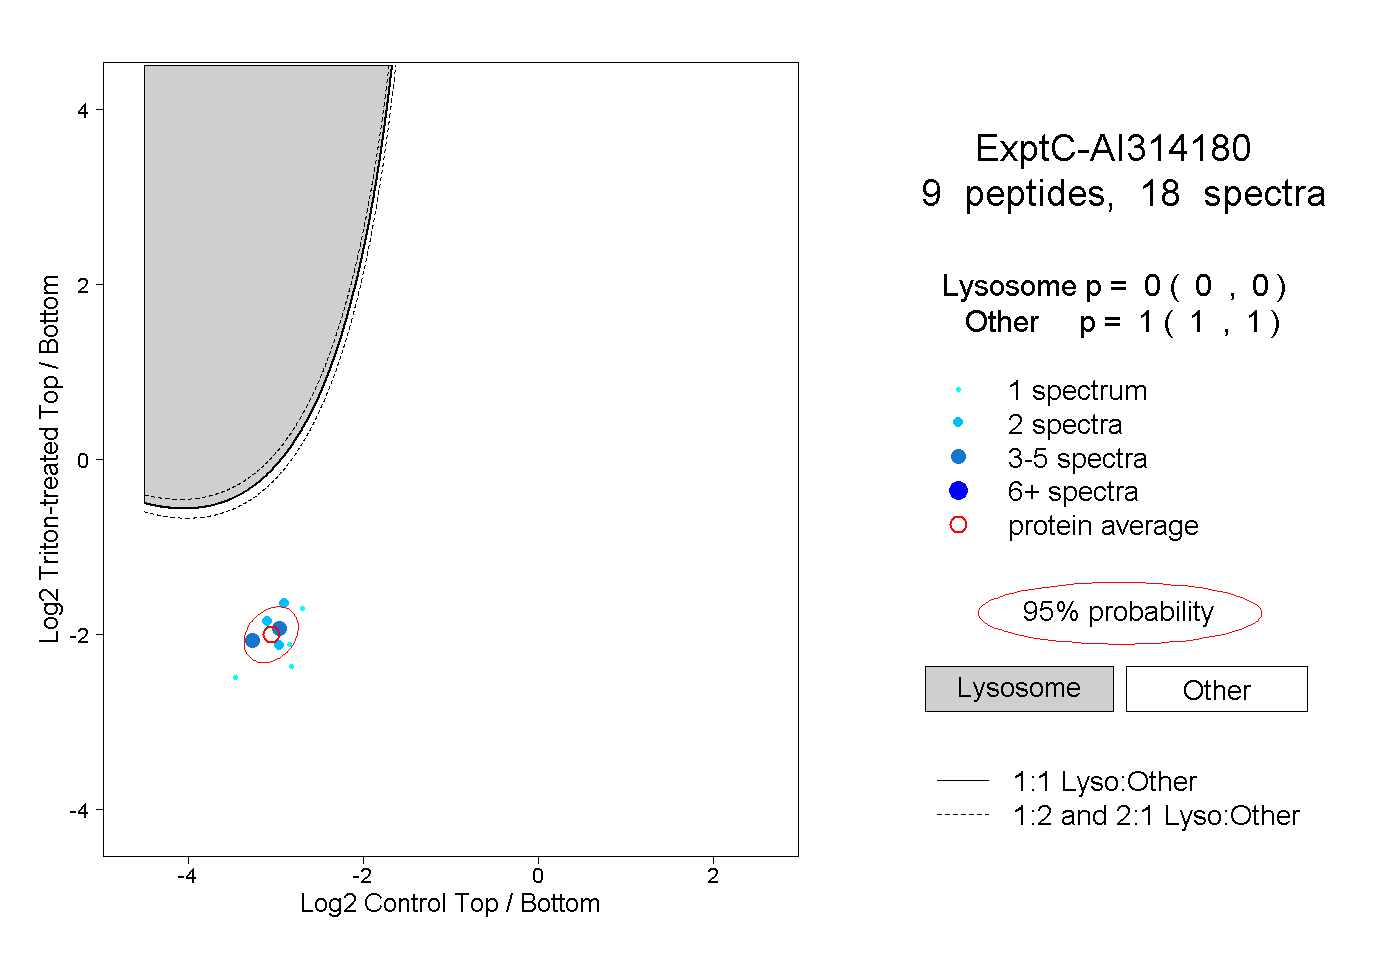 |
0.000 0.000 | 0.000 |
1.000 1.000 | 1.000 |
||||||||
| Plot | Lyso | Other | |||||||||||
| Expt D |
1 peptide |
1 spectrum |
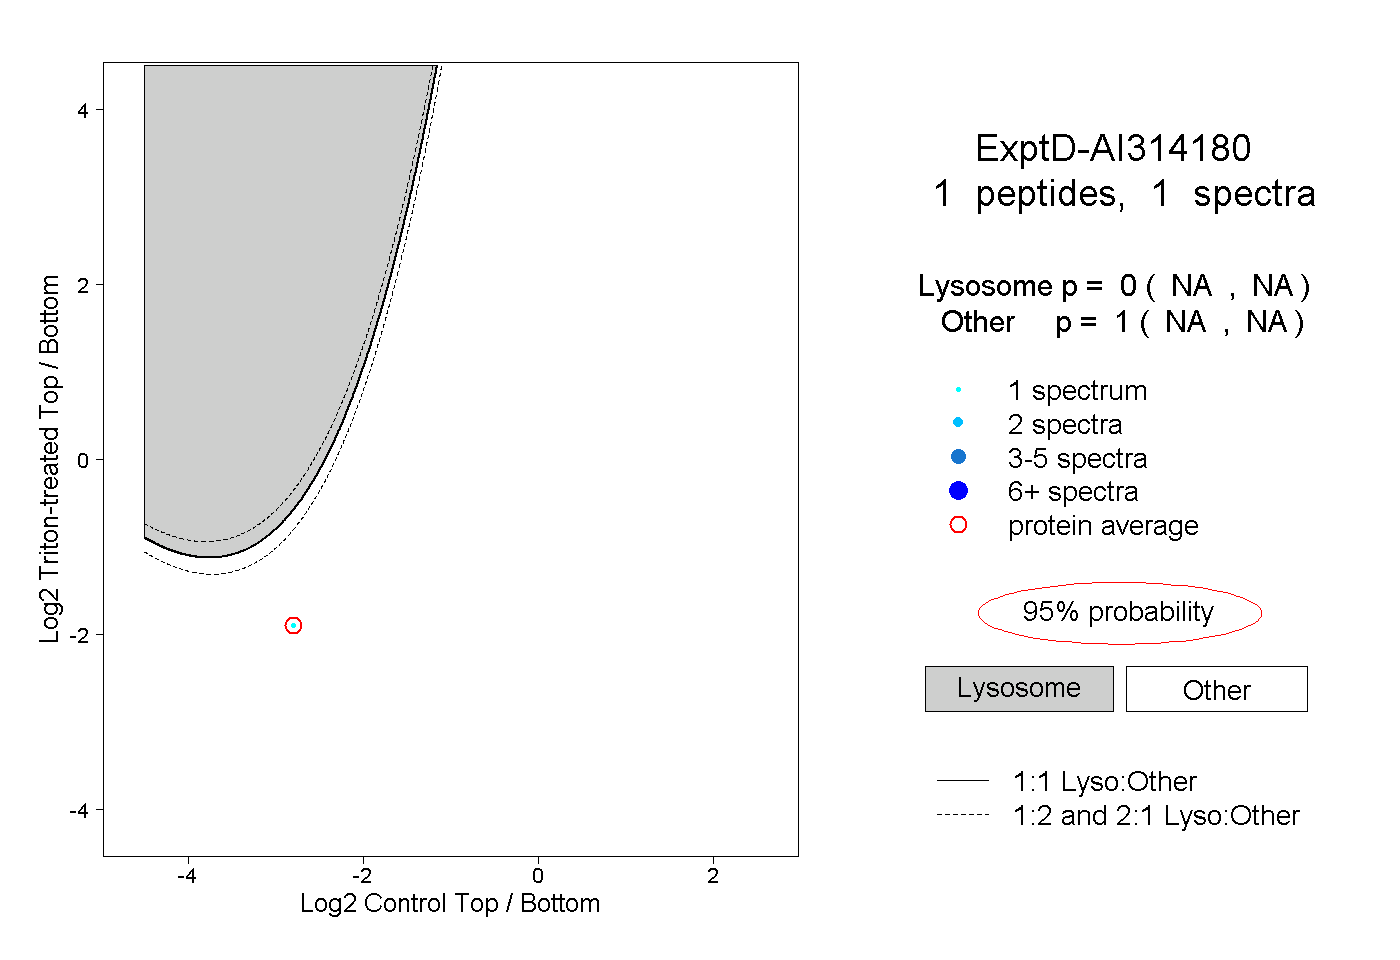 |
0.000 NA | NA |
1.000 NA | NA |