 18
18peptides
spectra
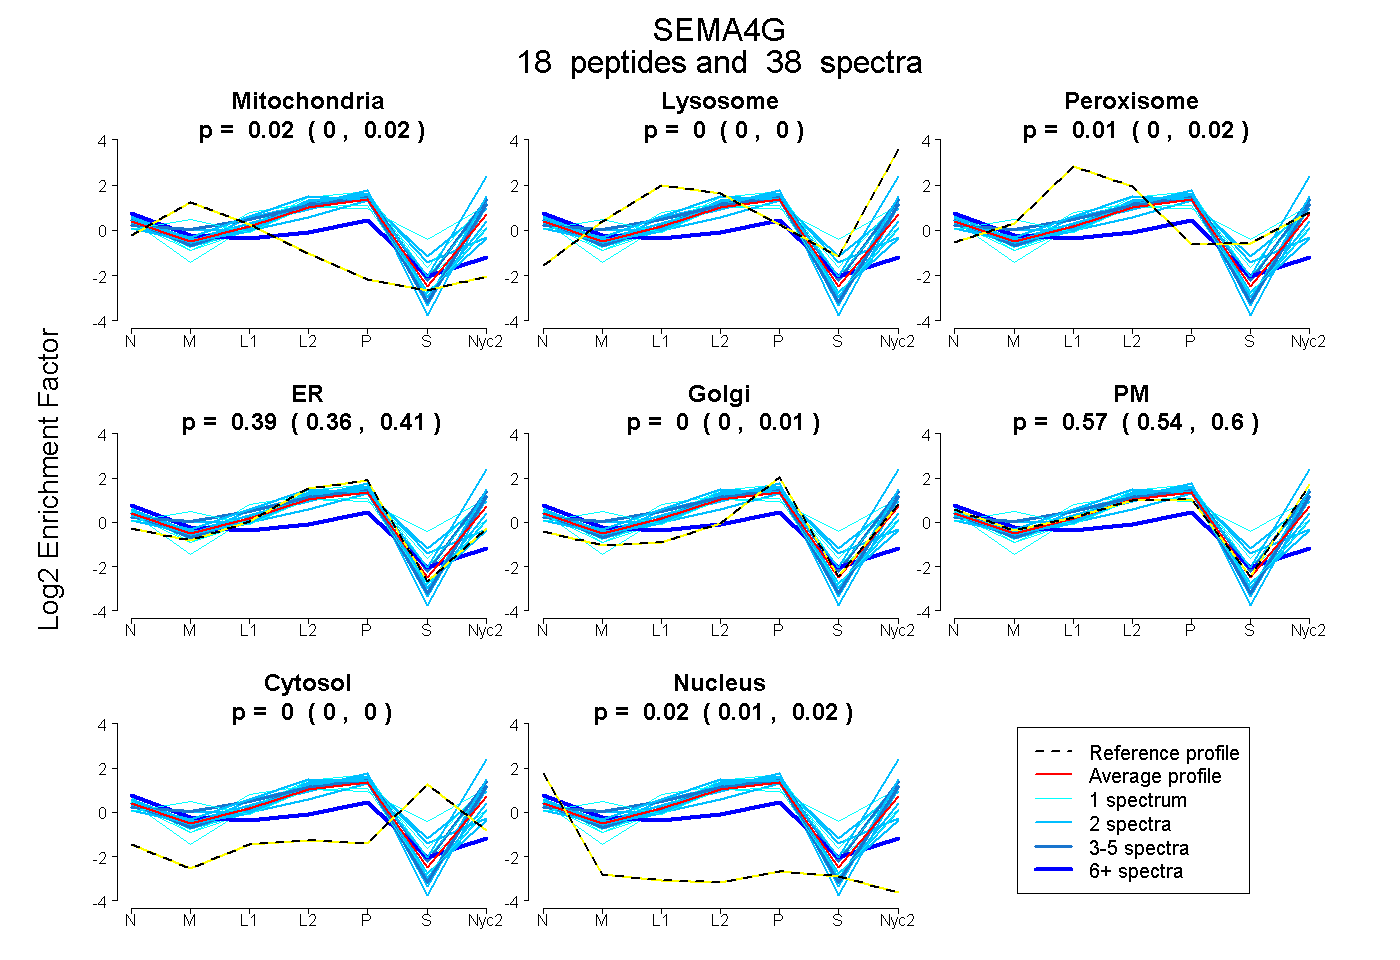
0.003 | 0.024
0.000 | 0.000
0.000 | 0.020
0.361 | 0.406
0.000 | 0.008
0.540 | 0.596
0.000 | 0.000
0.013 | 0.024
4peptides
spectra
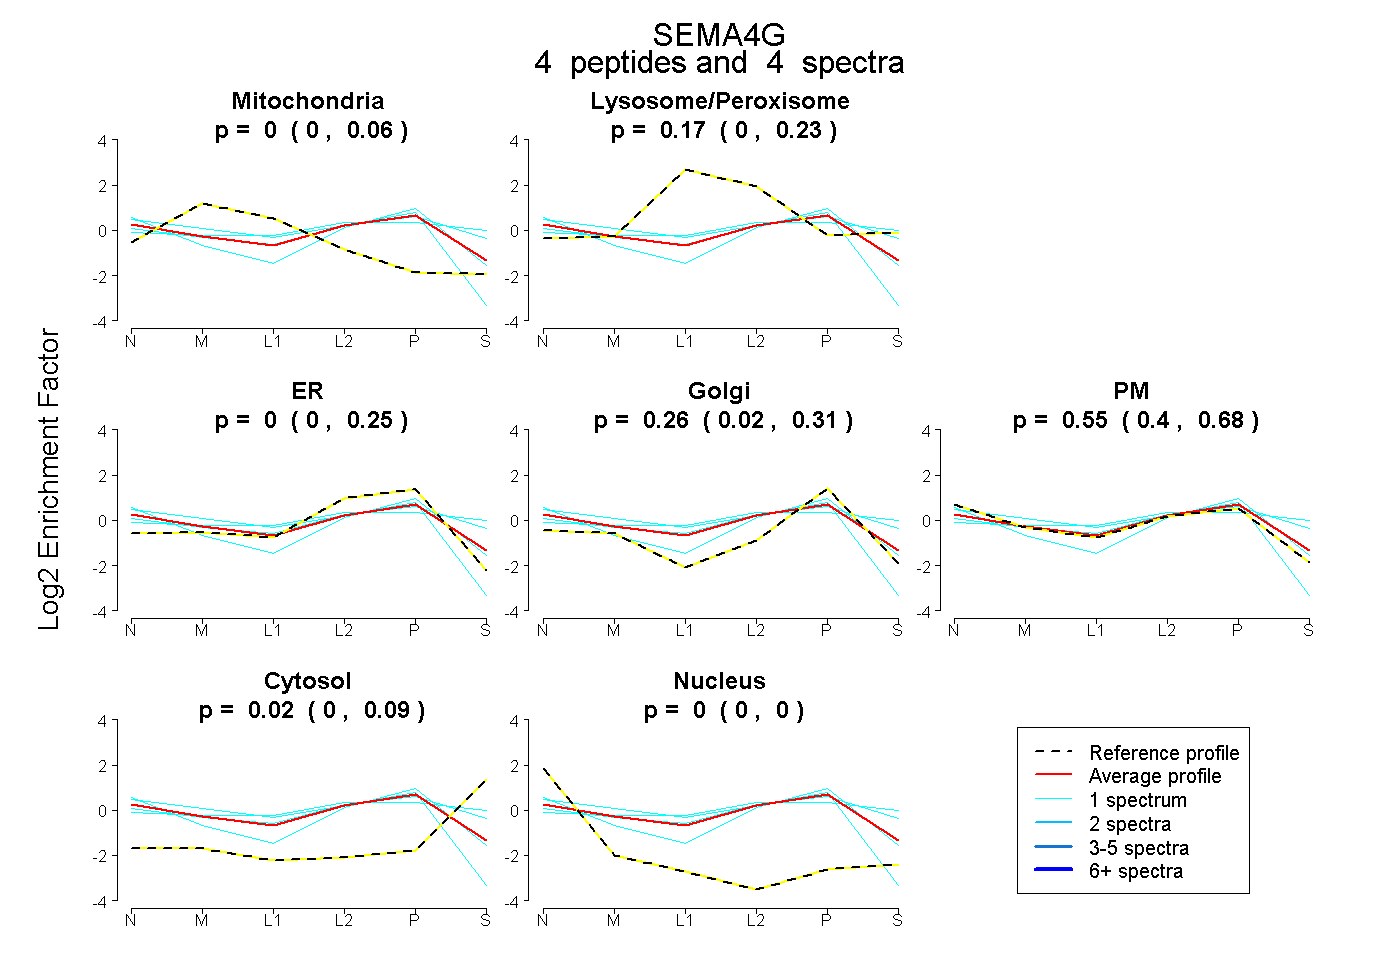
0.000 | 0.057
0.000 | 0.234
0.000 | 0.245
0.020 | 0.313
0.401 | 0.675
0.000 | 0.094
0.000 | 0.000
17peptides
spectra
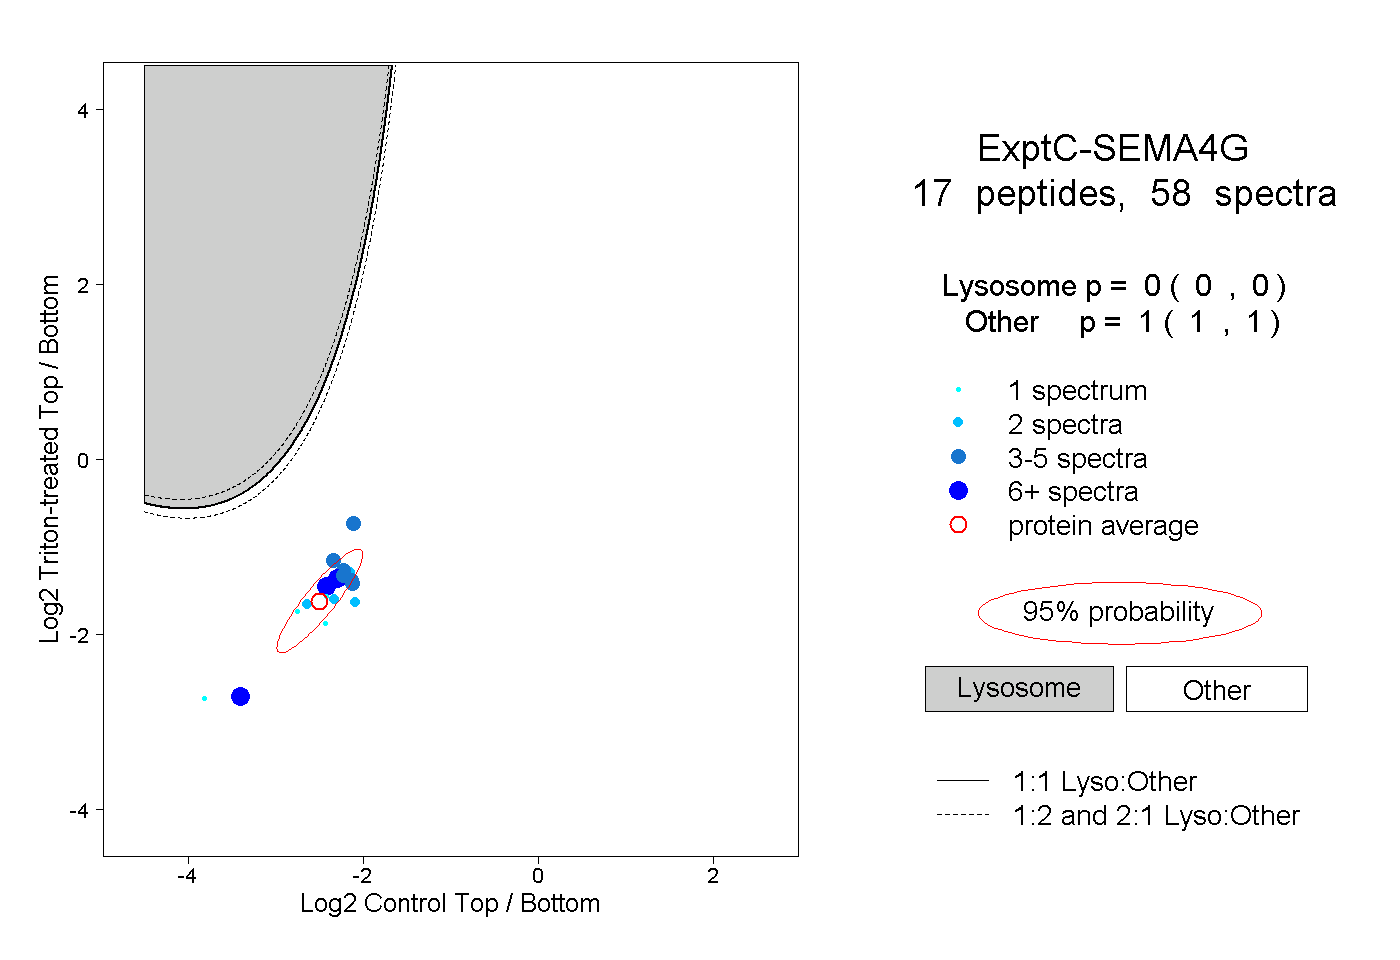
0.000 | 0.000
1.000 | 1.000
9peptides
spectra
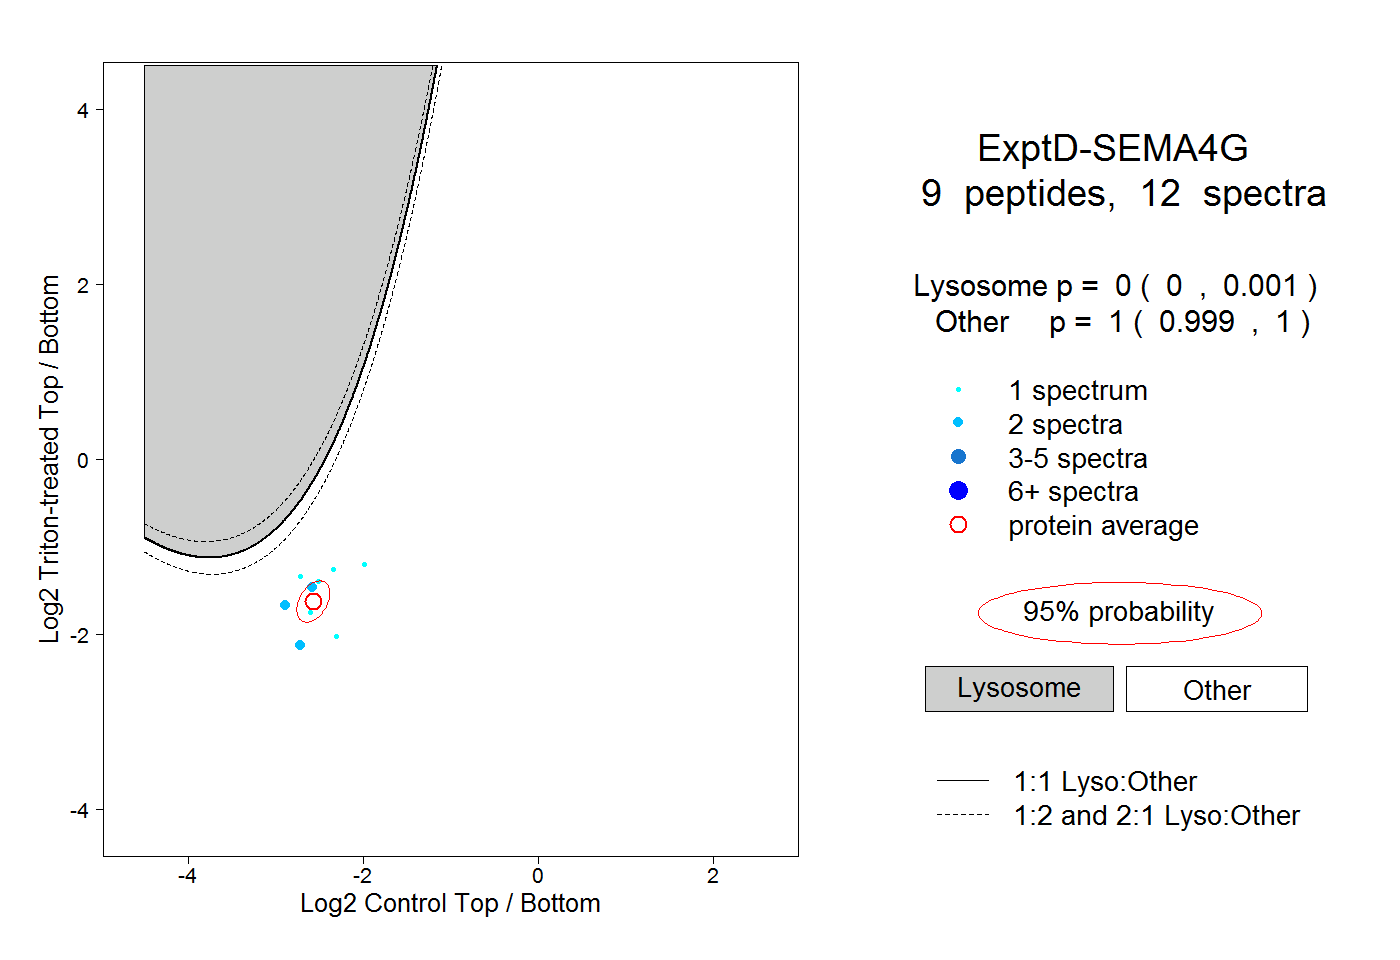
0.000 | 0.001
0.999 | 1.000