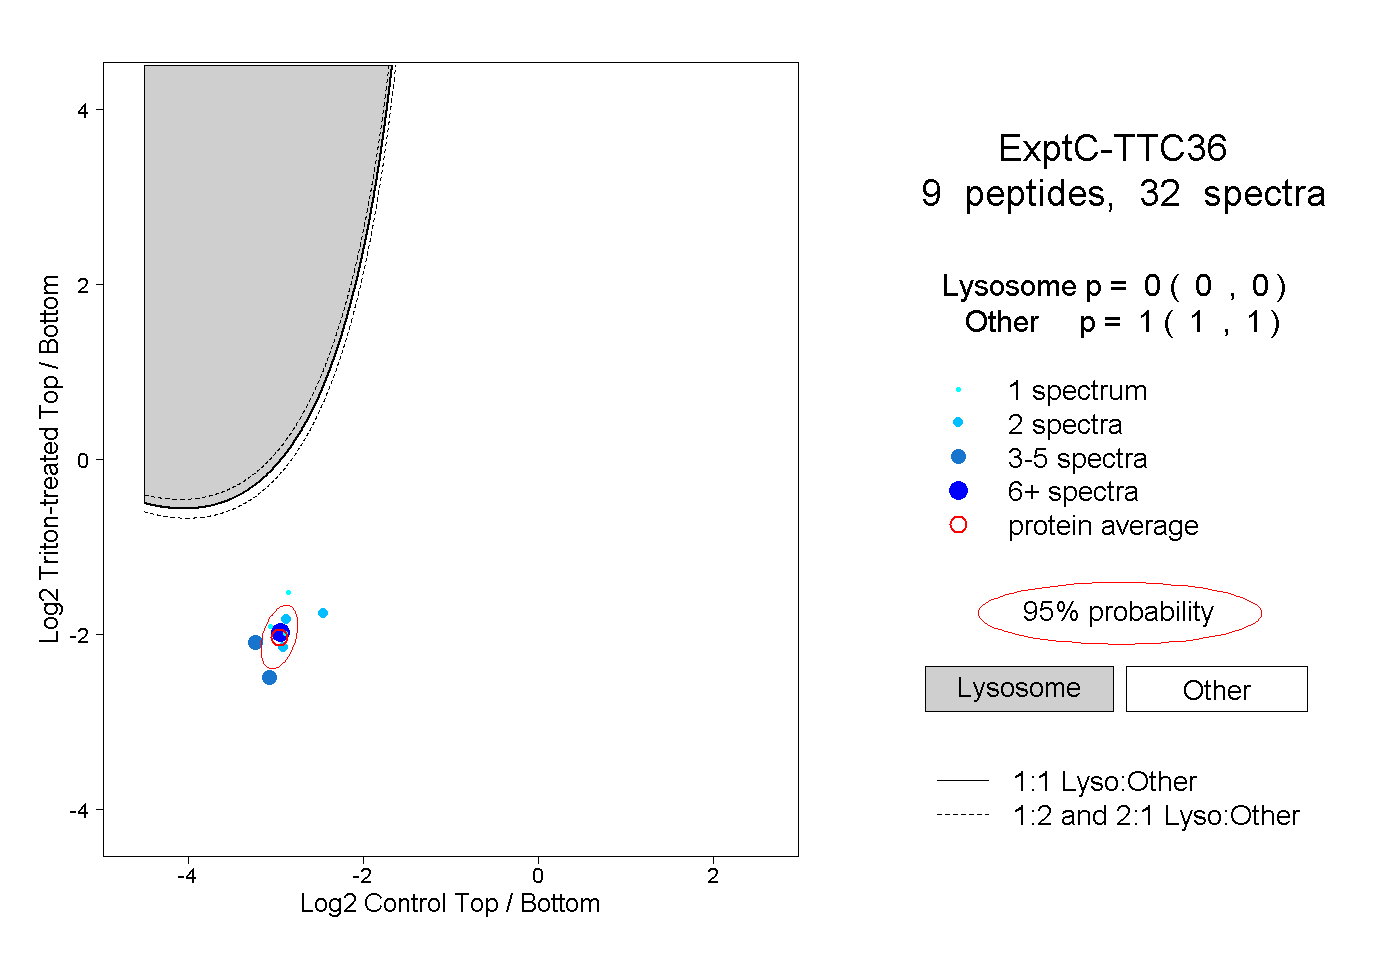
9
9peptides
spectra
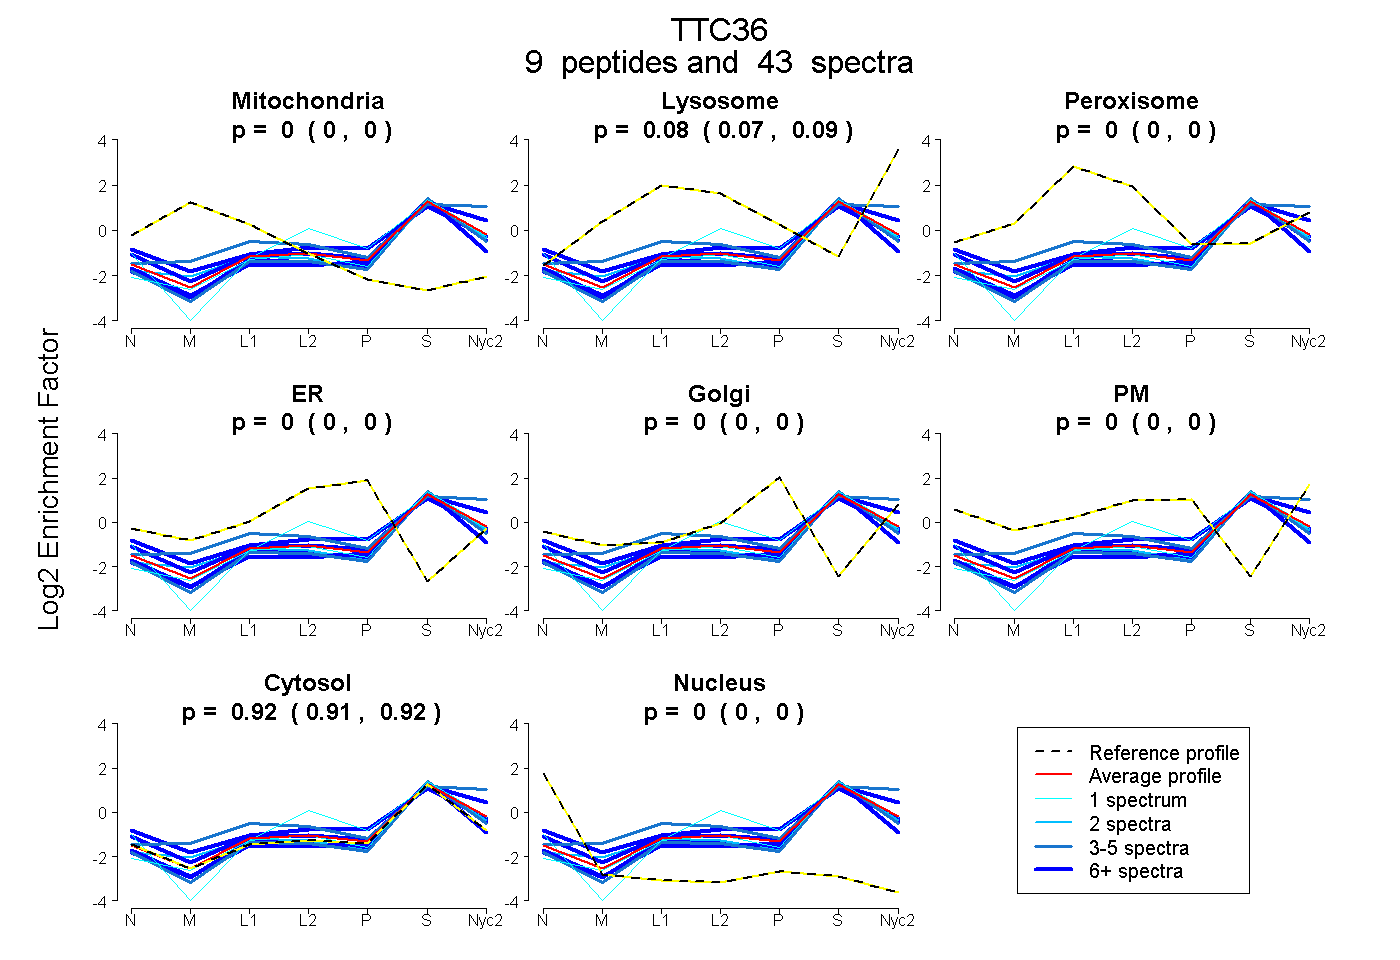
0.000 | 0.000
0.074 | 0.087
0.000 | 0.000
0.000 | 0.000
0.000 | 0.000
0.000 | 0.000
0.912 | 0.924
0.000 | 0.000
7peptides
spectra
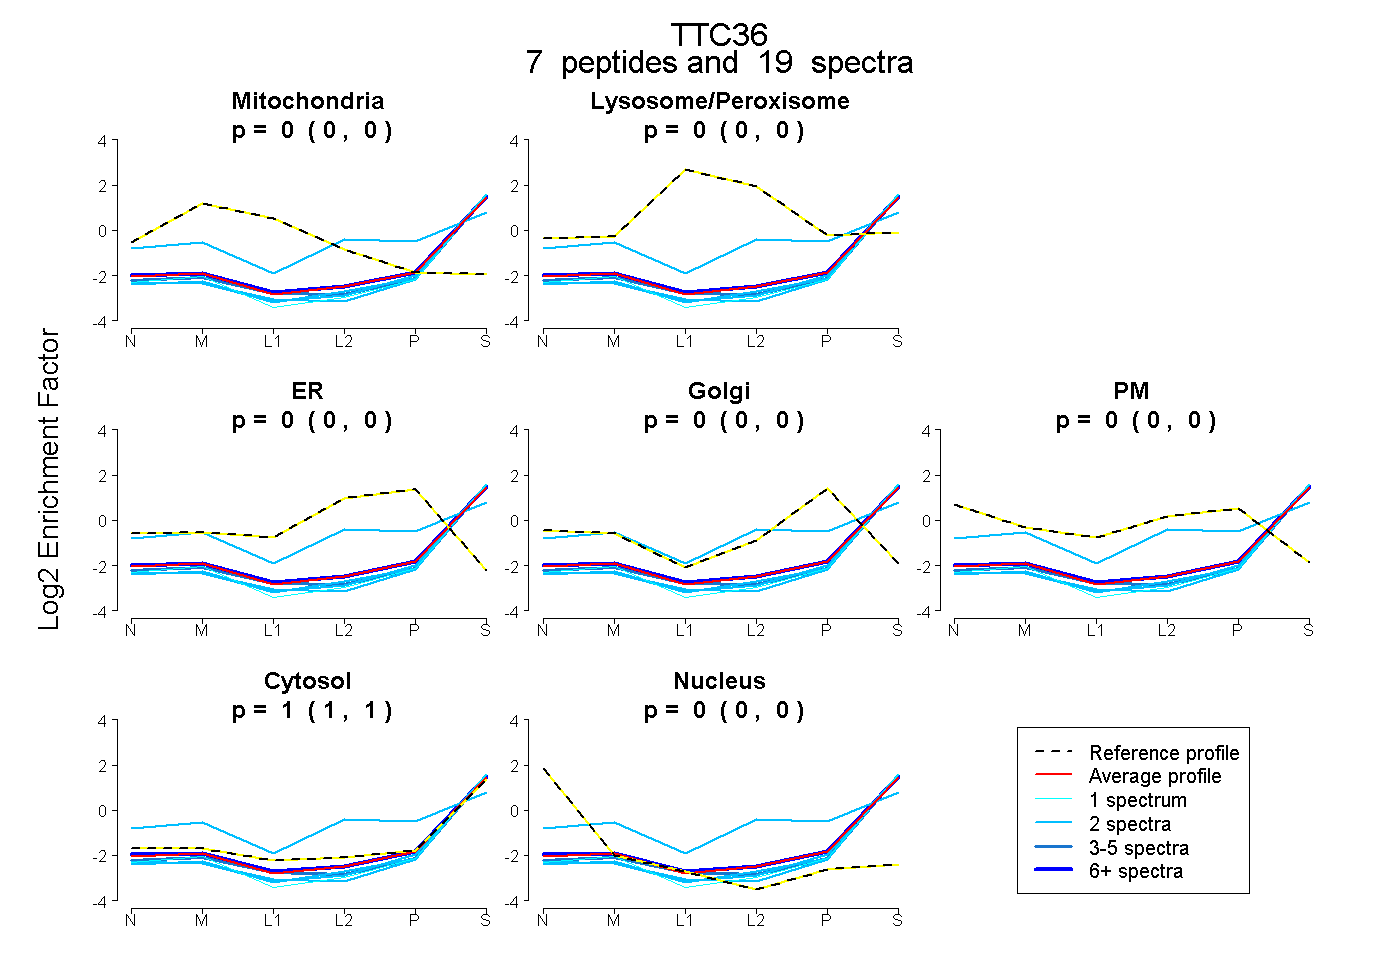
0.000 | 0.000
0.000 | 0.000
0.000 | 0.000
0.000 | 0.000
0.000 | 0.000
1.000 | 1.000
0.000 | 0.000