 9
9peptides
spectra
0.000 | 0.000
0.074 | 0.087
0.000 | 0.000
0.000 | 0.000
0.000 | 0.000
0.000 | 0.000
0.912 | 0.924
0.000 | 0.000
| Plot | Mito | Lyso | Perox | ER | Golgi | PM | Cytosol | Nucleus | |||||
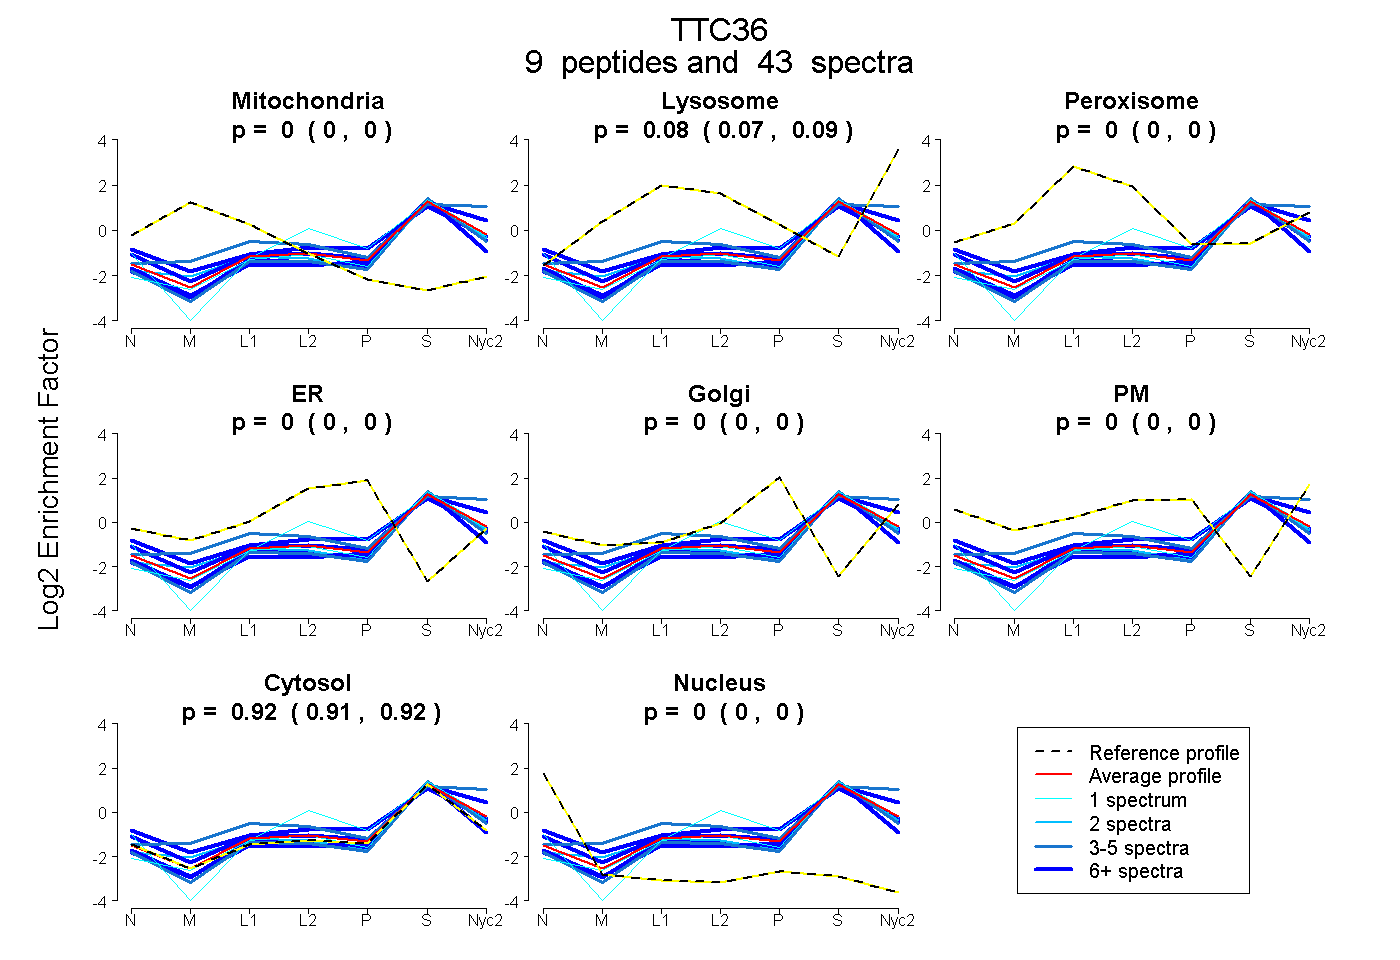
| Expt A |
9 peptides |
43 spectra |
|
0.000 0.000 | 0.000 |
0.082 0.074 | 0.087 |
0.000 0.000 | 0.000 |
0.000 0.000 | 0.000 |
0.000 0.000 | 0.000 |
0.000 0.000 | 0.000 |
0.918 0.912 | 0.924 |
0.000 0.000 | 0.000 |
| 5 spectra, AVTLSGGR | 0.000 | 0.000 | 0.000 | 0.000 | 0.000 | 0.000 | 1.000 | 0.000 | ||
| 8 spectra, ASAYNNR | 0.000 | 0.000 | 0.000 | 0.000 | 0.000 | 0.000 | 1.000 | 0.000 | ||
| 2 spectra, ALELQGVR | 0.000 | 0.069 | 0.000 | 0.000 | 0.000 | 0.000 | 0.930 | 0.000 | ||
| 8 spectra, DFEQAAR | 0.000 | 0.152 | 0.000 | 0.000 | 0.000 | 0.000 | 0.848 | 0.000 | ||
| 1 spectrum, LQGDVAGALEDLER | 0.000 | 0.055 | 0.000 | 0.000 | 0.000 | 0.000 | 0.945 | 0.000 | ||
| 3 spectra, LGSSFAR | 0.000 | 0.308 | 0.000 | 0.000 | 0.000 | 0.000 | 0.692 | 0.000 | ||
| 1 spectrum, QLVLLNPYAALCNR | 0.000 | 0.001 | 0.000 | 0.101 | 0.000 | 0.000 | 0.898 | 0.000 | ||
| 6 spectra, AAEAGDLHTALER | 0.000 | 0.012 | 0.050 | 0.000 | 0.000 | 0.136 | 0.802 | 0.000 | ||
| 9 spectra, AISLLPER | 0.000 | 0.003 | 0.000 | 0.000 | 0.000 | 0.000 | 0.997 | 0.000 |
| Plot | Mito | Lyso or Perox | ER | Golgi | PM | Cytosol | Nucleus | ||||||
| Expt B |
7 peptides |
19 spectra |
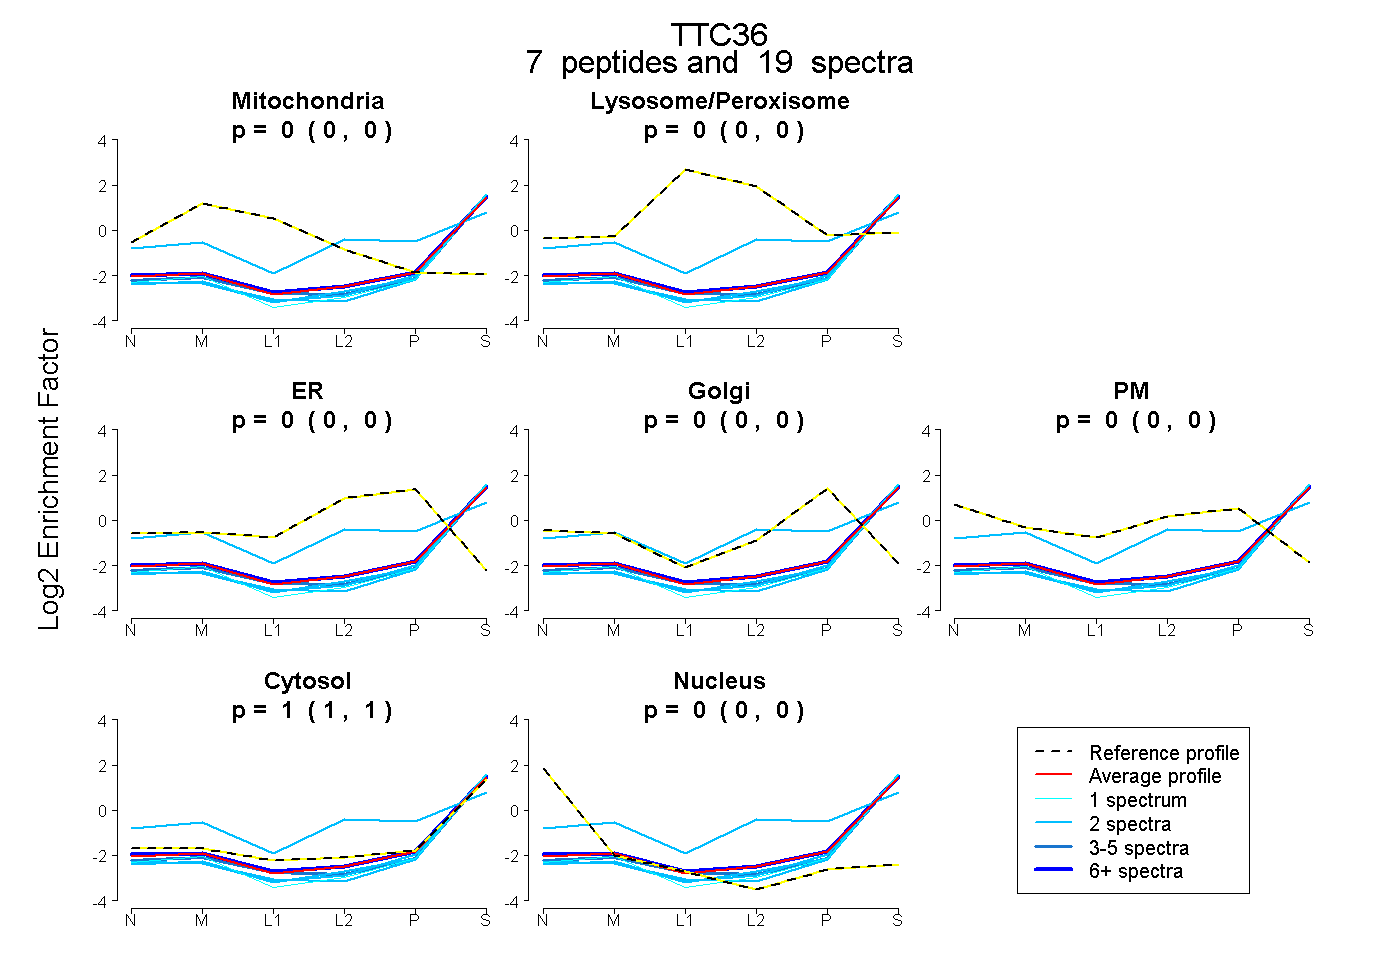 |
0.000 0.000 | 0.000 |
0.000 0.000 | 0.000 |
0.000 0.000 | 0.000 |
0.000 0.000 | 0.000 |
0.000 0.000 | 0.000 |
1.000 1.000 | 1.000 |
0.000 0.000 | 0.000 |
|||
| Plot | Lyso | Other | |||||||||||
| Expt C |
9 peptides |
32 spectra |
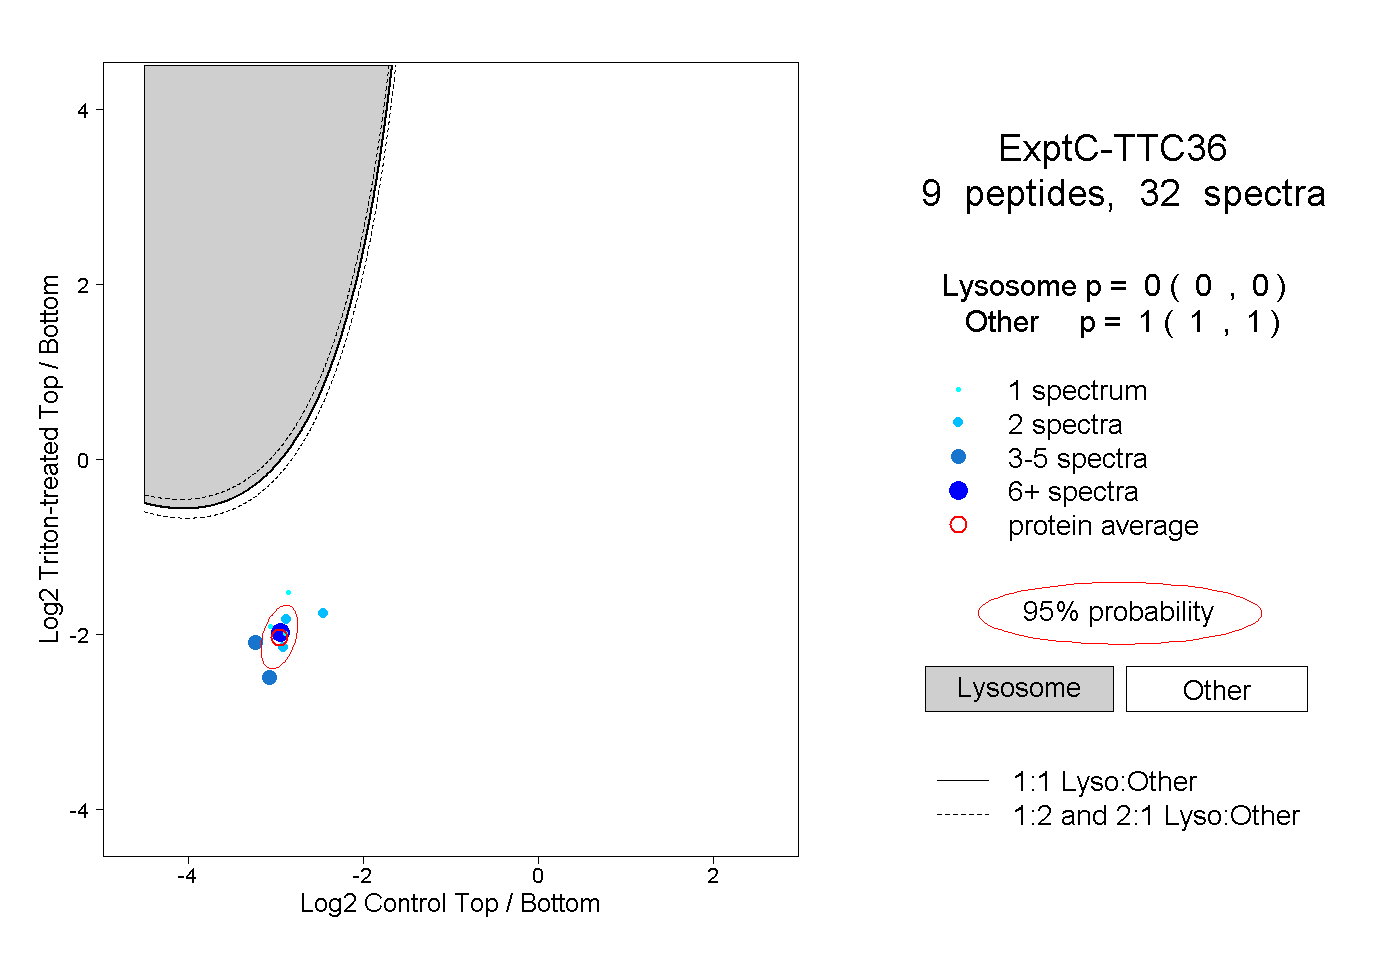 |
0.000 0.000 | 0.000 |
1.000 1.000 | 1.000 |