 2
2peptides
spectra
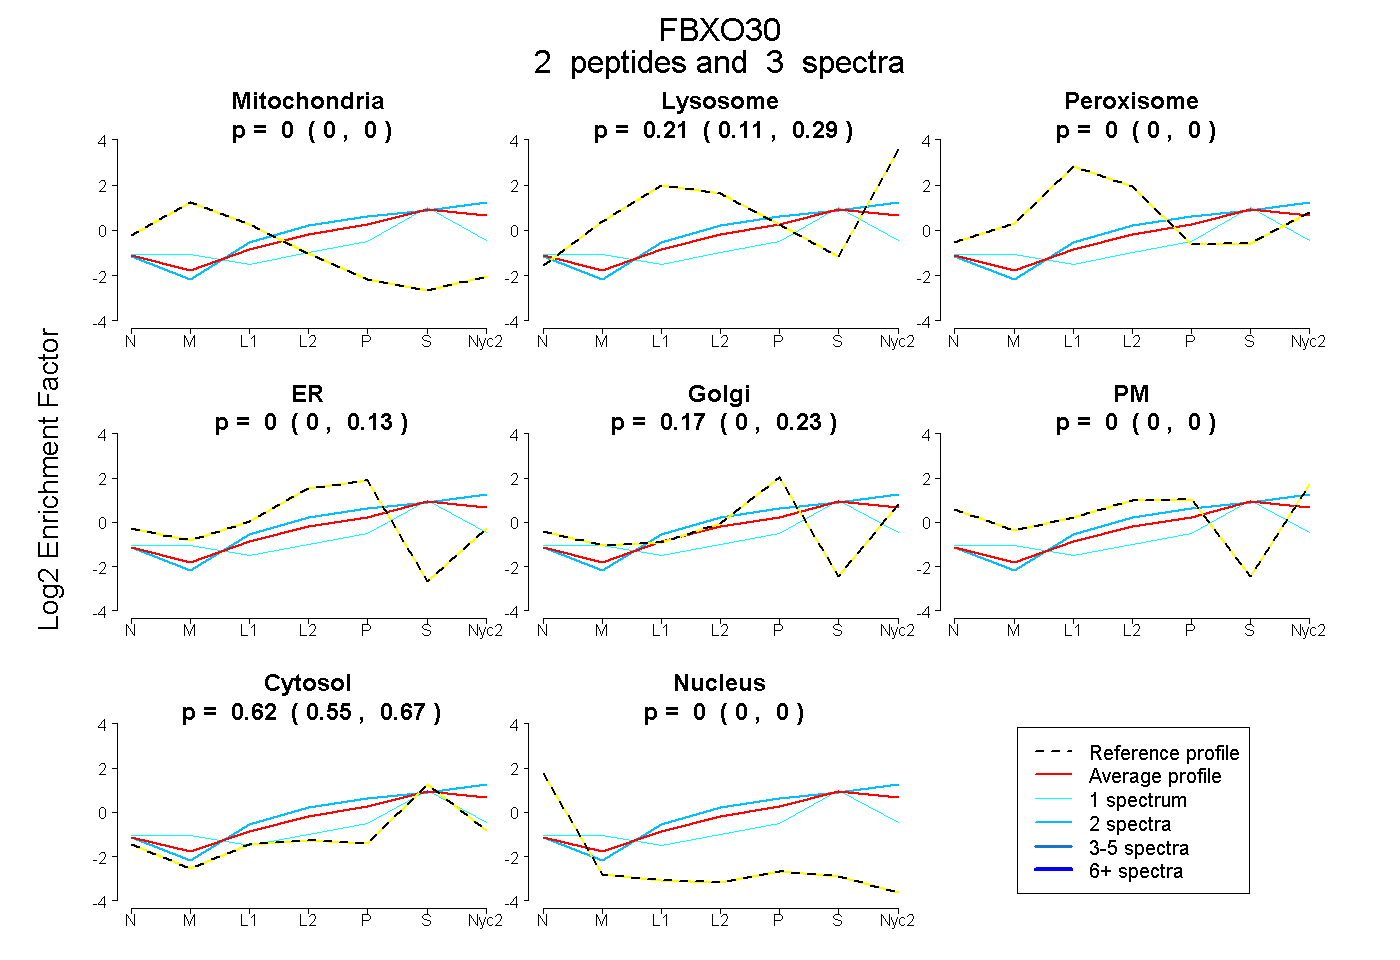
0.000 | 0.000
0.112 | 0.288
0.000 | 0.000
0.000 | 0.133
0.000 | 0.230
0.000 | 0.000
0.551 | 0.671
0.000 | 0.000
| Plot | Mito | Lyso | Perox | ER | Golgi | PM | Cytosol | Nucleus | |||||
| Expt A |
2 peptides |
3 spectra |
|
0.000 0.000 | 0.000 |
0.213 0.112 | 0.288 |
0.000 0.000 | 0.000 |
0.000 0.000 | 0.133 |
0.171 0.000 | 0.230 |
0.000 0.000 | 0.000 |
0.616 0.551 | 0.671 |
0.000 0.000 | 0.000 |
| 2 spectra, DLGDSK | 0.000 | 0.292 | 0.000 | 0.000 | 0.170 | 0.000 | 0.539 | 0.000 | ||
| 1 spectrum, SYESLSR | 0.065 | 0.047 | 0.000 | 0.000 | 0.145 | 0.000 | 0.742 | 0.000 |
| Plot | Lyso | Other | |||||||||||
| Expt C |
1 peptide |
5 spectra |
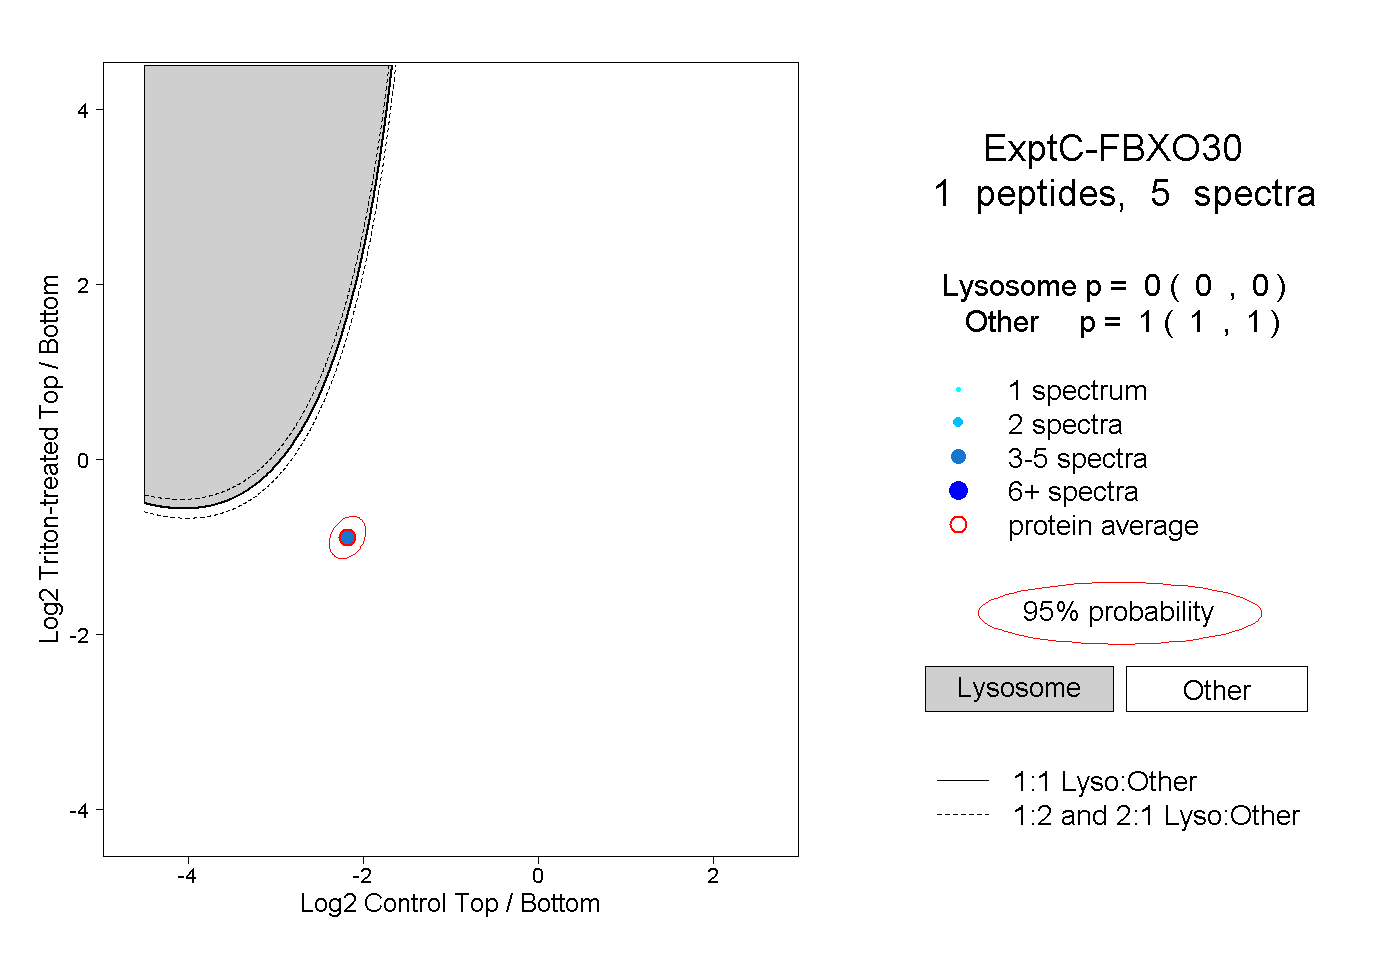 |
0.000 0.000 | 0.000 |
1.000 1.000 | 1.000 |